
A monetary lapse of reason


“Observers looking for a parallel to the present should consider 1998. The Fed juiced an economy propelled by a concentrated capex boom with 75 basis points of easing because a hedge fund failed. The already frothy Nasdaq Composite tripled over the next 15 months.”
So we wrote ten months ago (A Whiff of Stagflation). Our reasoning was simple: rate cuts delivered during a concentrated capex boom tend to prove far more stimulative than rate cuts arriving in other circumstances. Since then, the Philadelphia Semiconductor Index is up 2.3x as the spending driving its constituents’ results has gone parabolic (Figure 1).
Figure 1: Not hard to see why investors like AI hardware stocks
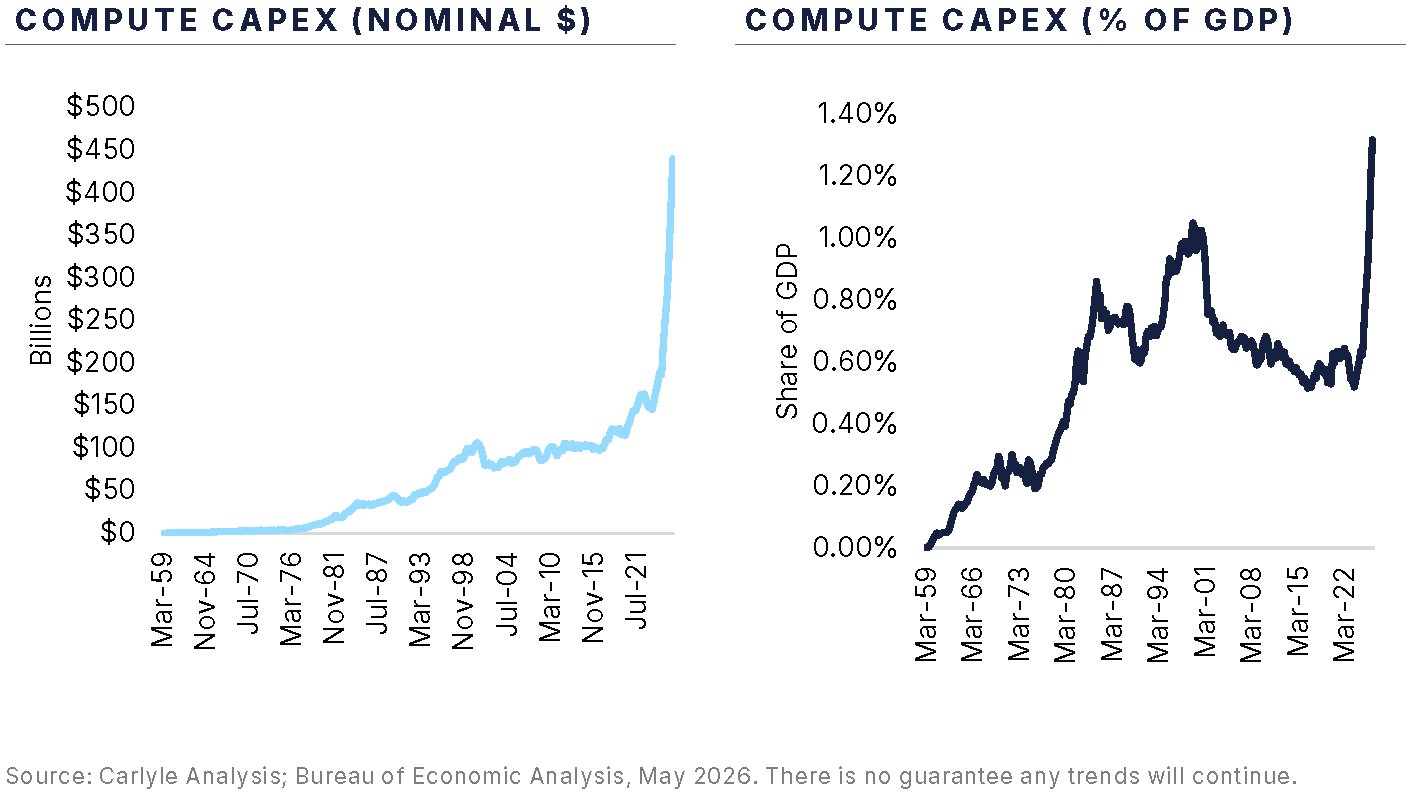
Nothing peeved Milton Friedman quite like the commonly held assumption that the stance of monetary policy could be judged based on the level of short-term interest rates. Policy could be too loose even with short-term rates twice their prior level, as Italy demonstrated from 1971 to 1977. Policy could also be too tight even with rates pinned at zero, as Japan proved between 1999 and 2006. Instead of looking at current interest rates relative to the past, policy should be evaluated based on the behavior of macroeconomic aggregates like inflation, nominal income, and (in Friedman’s day) the money supply.
But that’s not how things work in the “real world,” is it? Especially when rates exhibit a step-function increase from zero to more than 5%, as in the US between March 2022 and July 2023. Who among us can escape the inclination to think that current rates must be “too high” when they sit so far above prior levels?
We collect data on prices paid and received from a sample of more than 150 companies each month. We then calibrate these data to official statistics to estimate the overall rate of inflation likely to generate the price trends we observe. In just two of the past 63 months (3% of observations) has this exercise pointed to an annual inflation rate plausibly running at or below the Fed’s 2% target. And not once have our portfolio data suggested the economy was at material risk of falling into recession.
These data were no match for our collective mental anchor to the past. After heroically bringing inflation down to 3%, policymakers became hypersensitized to any sign of labor market weakness. By mid-2024, it was obvious that the Fed had no stomach for traversing the “last mile” of inflation stabilization (Soft Landing’s Illusory Victory). Markets endogenized this easing bias, with each “print” examined for clues about the magnitude and timing of the Fed’s next rate cut.
In this environment, the “neutral” rate of interest ceased functioning as an analytical construct. It served as a rhetorical tool, invoked repeatedly to make the case for rate cuts that couldn’t be justified using readily observable data like inflation, GDP growth (relative to prior trend), or unemployment (Are U.S. Policy Rates “Restrictive”?). Policymakers were to believe speculative estimates rather than their lying eyes.
The Fed unveiled a “flexible average inflation target” (FAIT) in August 2020 to allow inflation to exceed 2% (temporarily) to compensate for prior shortfalls. Had the FAIT been applied symmetrically, the Fed would have treated 2% inflation as a ceiling after 2023, an approach likely to have been welcomed by voters disaffected by the cost-of-living shock (No Easy Way Out). Instead, the 25% cumulative increase in the consumer price level would have no bearing on future policy, no matter how much the escalation in prices rankled the households the Fed ostensibly serves.
To add to the madness, elected officials applied more pressure for cuts, likely motivated, in part, by a desire to reduce federal debt service costs (Through the Looking Glass). A dovish central bank was pulled in an even more dovish direction, allowing its imprudence to be recast as fortitude.
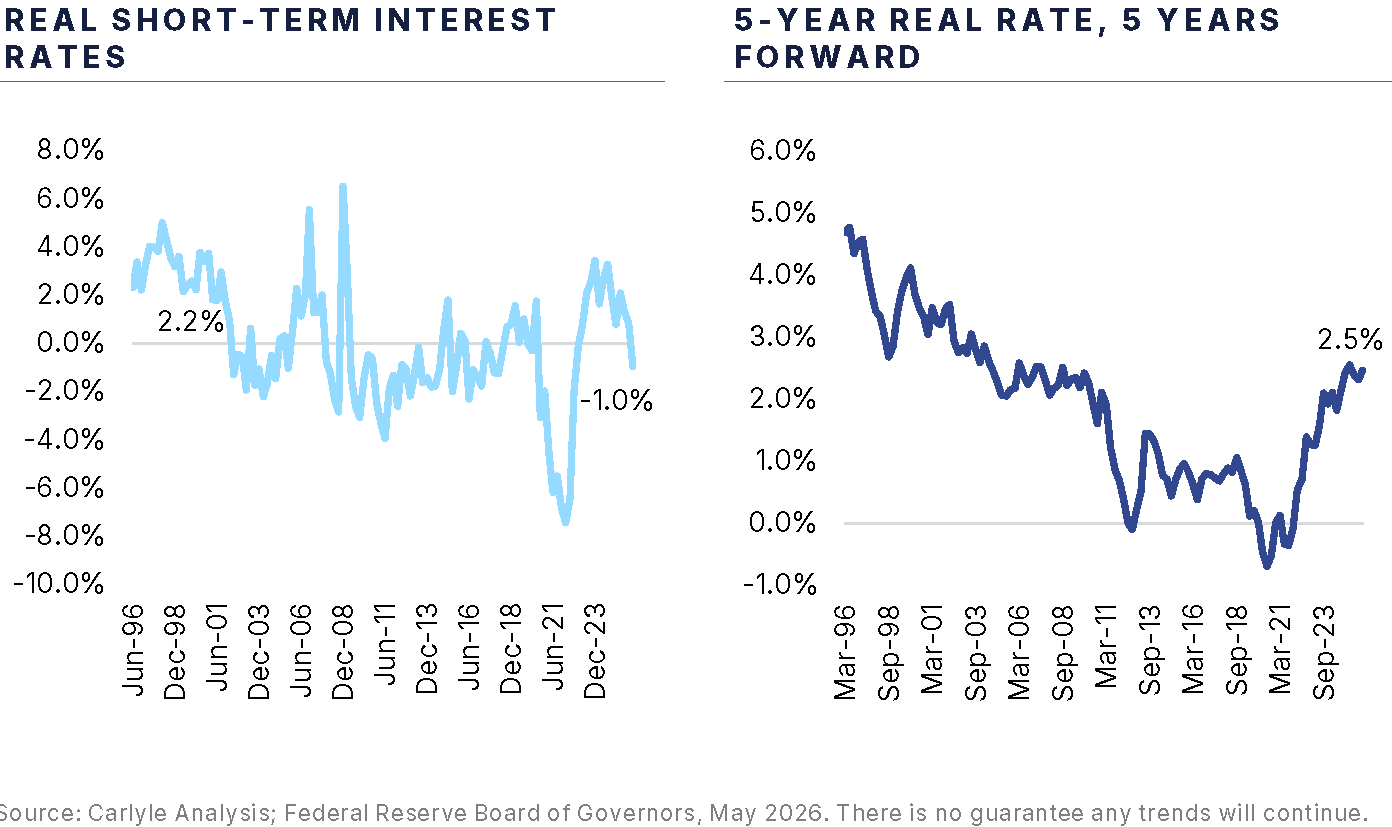
Today, real short-term interest rates sit more than 300bps below levels prevailing during the capex boom of the 1990s and the terminal rates implied by inflation-protected bonds (Figure 2). As Vito Corleone asked his assembled guests: “How did things ever get so far?” This is the question Kevin Warsh should pose to colleagues when he chairs his first Federal Open Market Committee meeting later this month.
Don’t expect any movement this meeting or next; the option value of waiting is too high given the scale of uncertainty introduced by the Strait of Hormuz closure. But it’s long past time to abandon the endemic easing bias that’s characterized policy for the past two years.
Figure 2: Are negative real rates appropriate today?
Economic and market views and forecasts reflect our judgment as of the date of this presentation and are subject to change without notice. In particular, forecasts are estimated, based on assumptions, and may change materially as economic and market conditions change. Pacharbor Capital Group has no obligation to provide updates or changes to these forecasts. Certain information contained herein has been obtained from sources prepared by other parties, which in certain cases have not been updated through the date hereof. While such information is believed to be reliable for the purpose used herein, Pacharbor Capital Group and its affiliates assume no responsibility for the accuracy, completeness or fairness of such information. This material should not be construed as an offer to sell or the solicitation of an offer to buy any security in any jurisdiction where such an offer or solicitation would be illegal. We are not soliciting any action based on this material. It is for the general information of investors of Pacharbor Capital Group. It does not constitute a personal recommendation or take into account the particular investment objectives, financial situations, or needs of individual investors.