
Resilient growth, rising costs, growing divergence


Key Findings from Pacharbor Capital Group’s Indicators
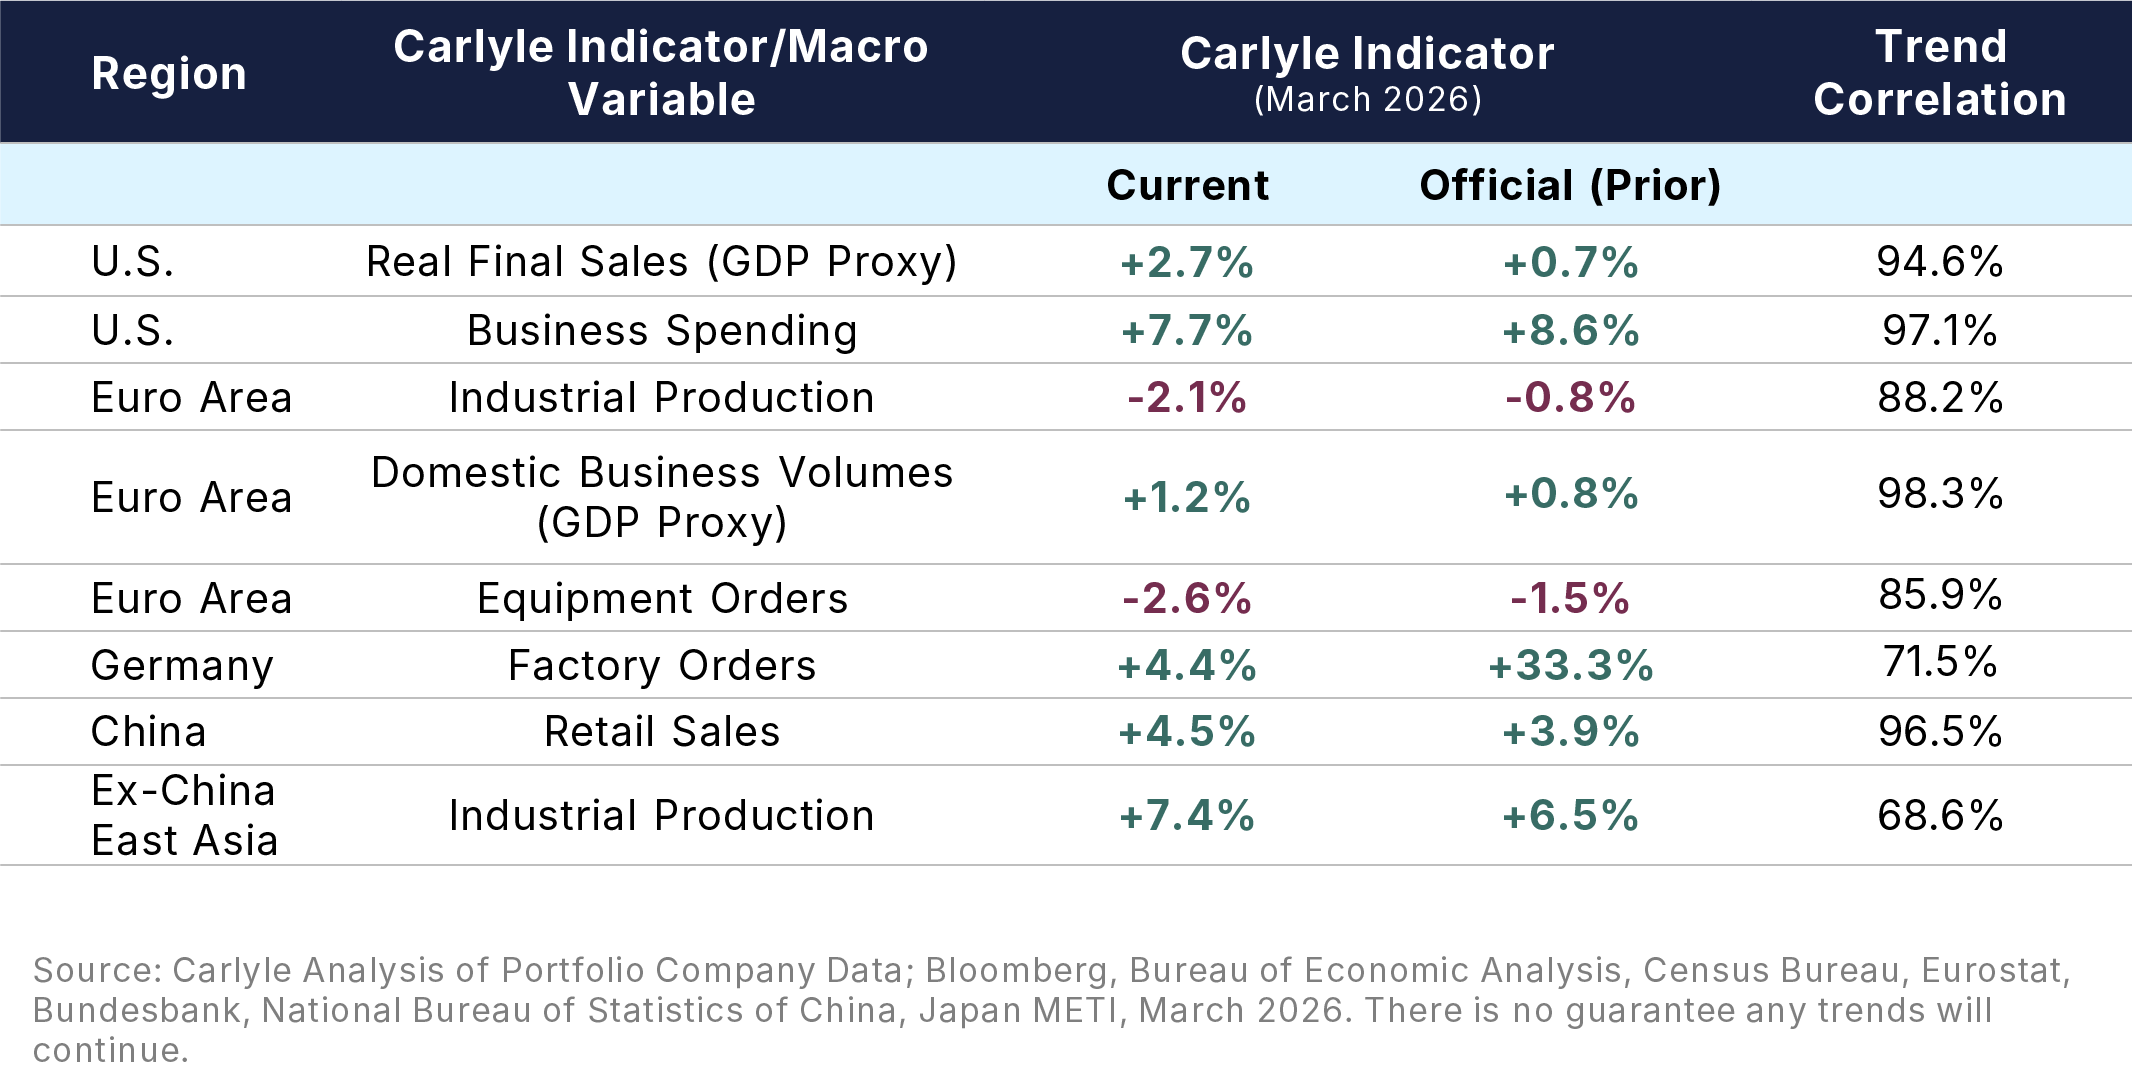
We view the economy through the lens of our global portfolio. At quarter’s end, that consisted of 293 businesses operating in over 30 countries and employing more than 700,000 workers. Each month, we collect key performance indicators (KPIs) from these companies – order books, shipments, backlogs, subscriptions, prices paid/prices received, etc. – and algorithmically weight these data relative to official statistics to estimate, in real-time, what the most recent batch of results imply about broader economic conditions. Table 1 reports a sampling of the macro estimates derived from our KPIs and their historic predictive power (i.e. the correlation with the next three months of official data).
Table 1: March 2026 data table
A few takeaways…
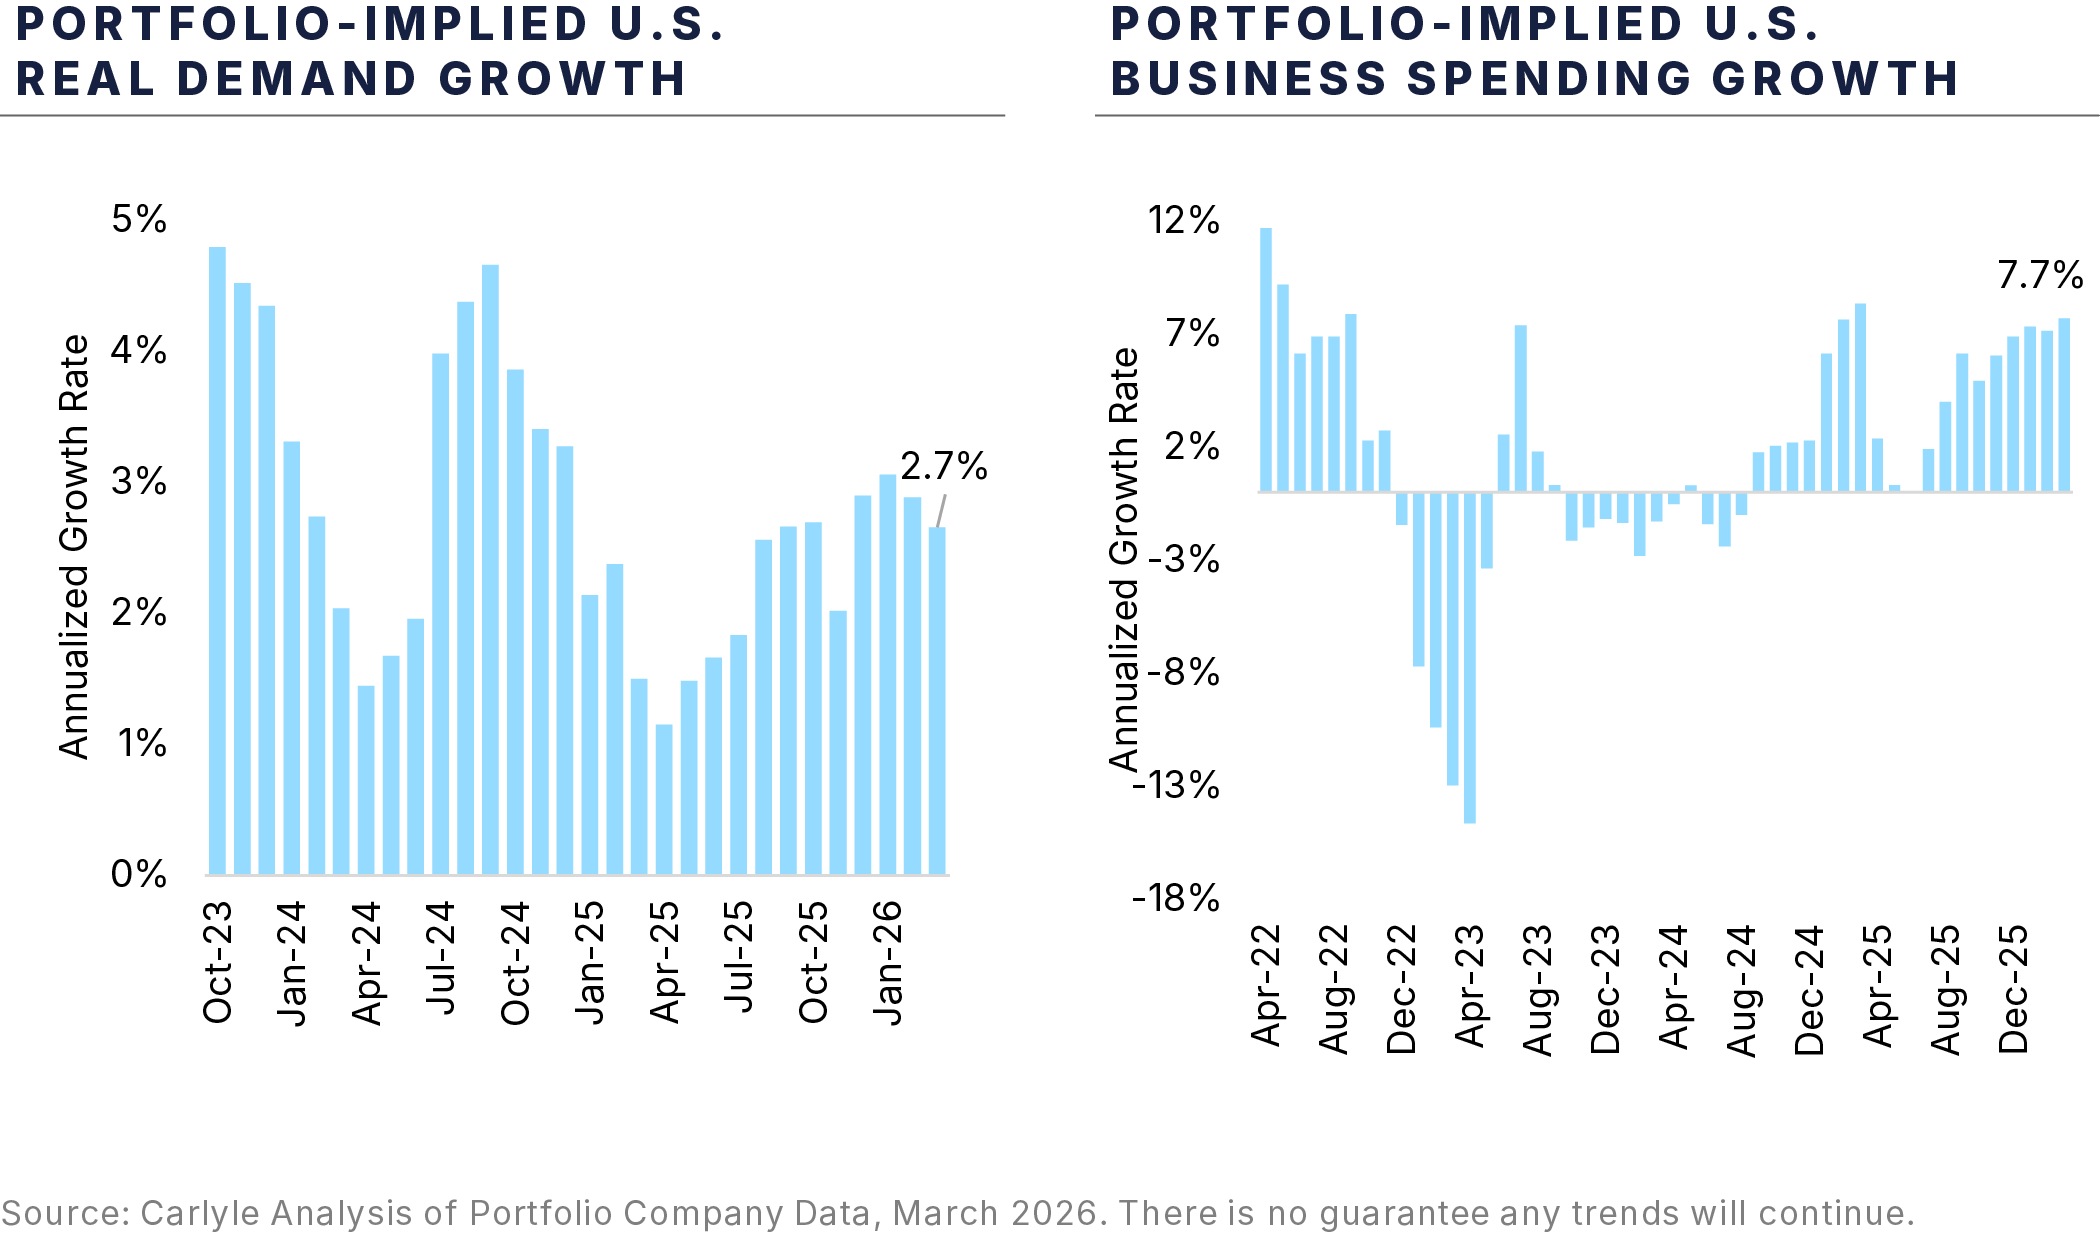
The U.S. economy retains underlying momentum (Figure 1). Our measure of real final demand – a proxy for real GDP net of foreign trade and inventories – grew at a 2.7% annualized rate in Q1, a result consistent with 5.7% year-over-year growth in S&P 1500 revenue. Business spending advanced at a 7.7% annualized rate and we saw no obvious signs of deterioration in the labor market. Aggregate U.S. wages grew at nearly a 5% annualized rate in the quarter, a slight acceleration from Q4-2025.
Figure 1: Momentum in U.S. economy
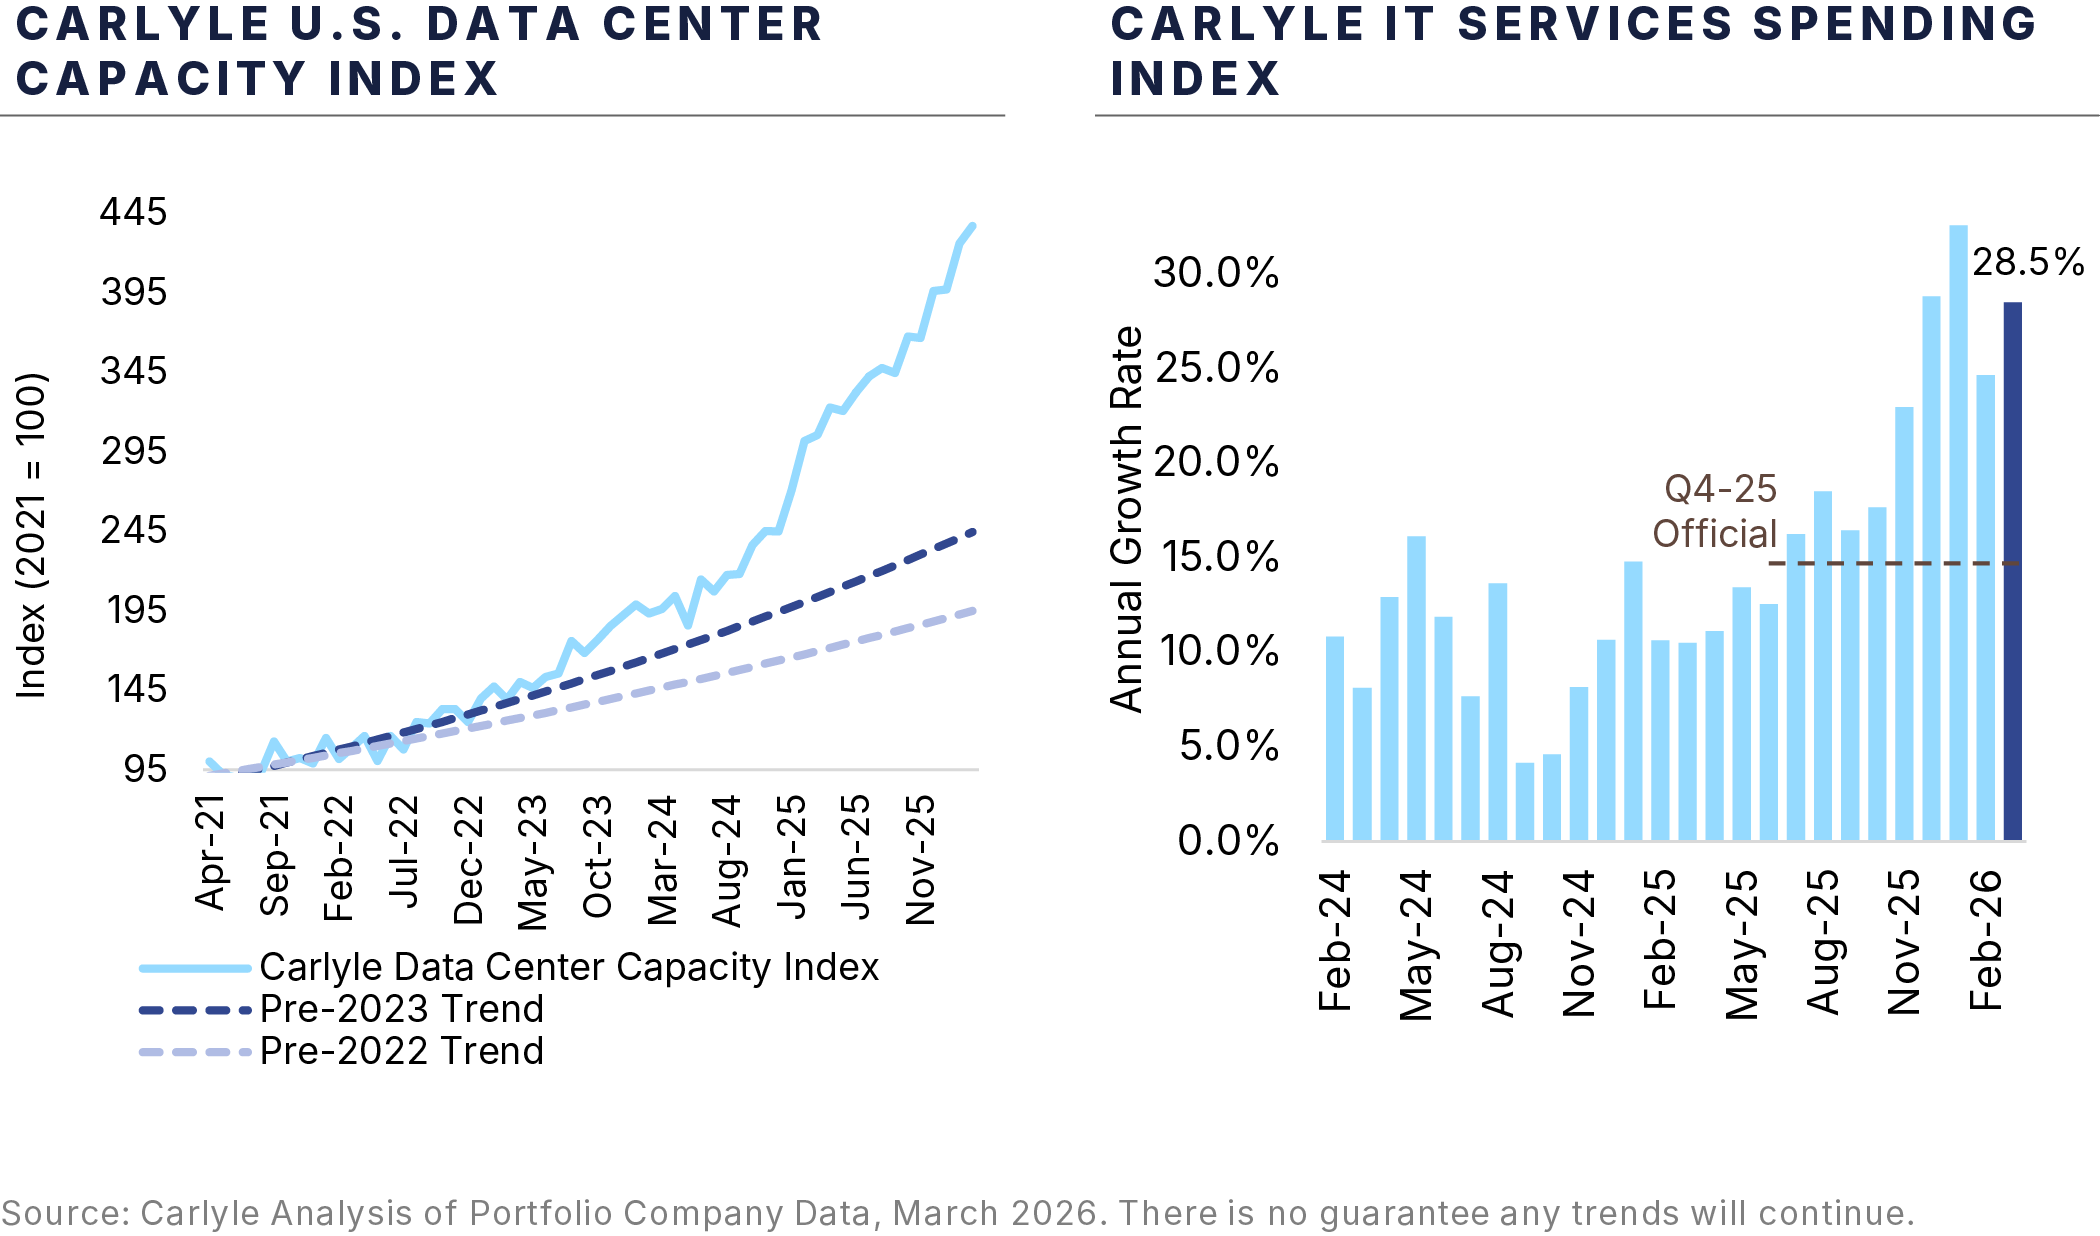
AI explains much of the strength in business outlays (Figure 2). That’s not just the capex associated with data centers, which continues to grow at prodigious rates, but also enterprise IT budgets, which increased by 28% (annualized) in Q1, nearly 2x the growth observed in Q4-2025. The need to devise and implement “AI strategies” has empowered Chief Technology/Information Officers, whose budget requests have moved from “nice to have” to top corporate priority. Much of the spending thus far has been concentrated in data capture, storage, and analytics. Companies report huge value from dynamic pricing algorithms, which have allowed them to optimize prices across customers and products/SKUs.
Figure 2: AI explains most of the growth in business spending
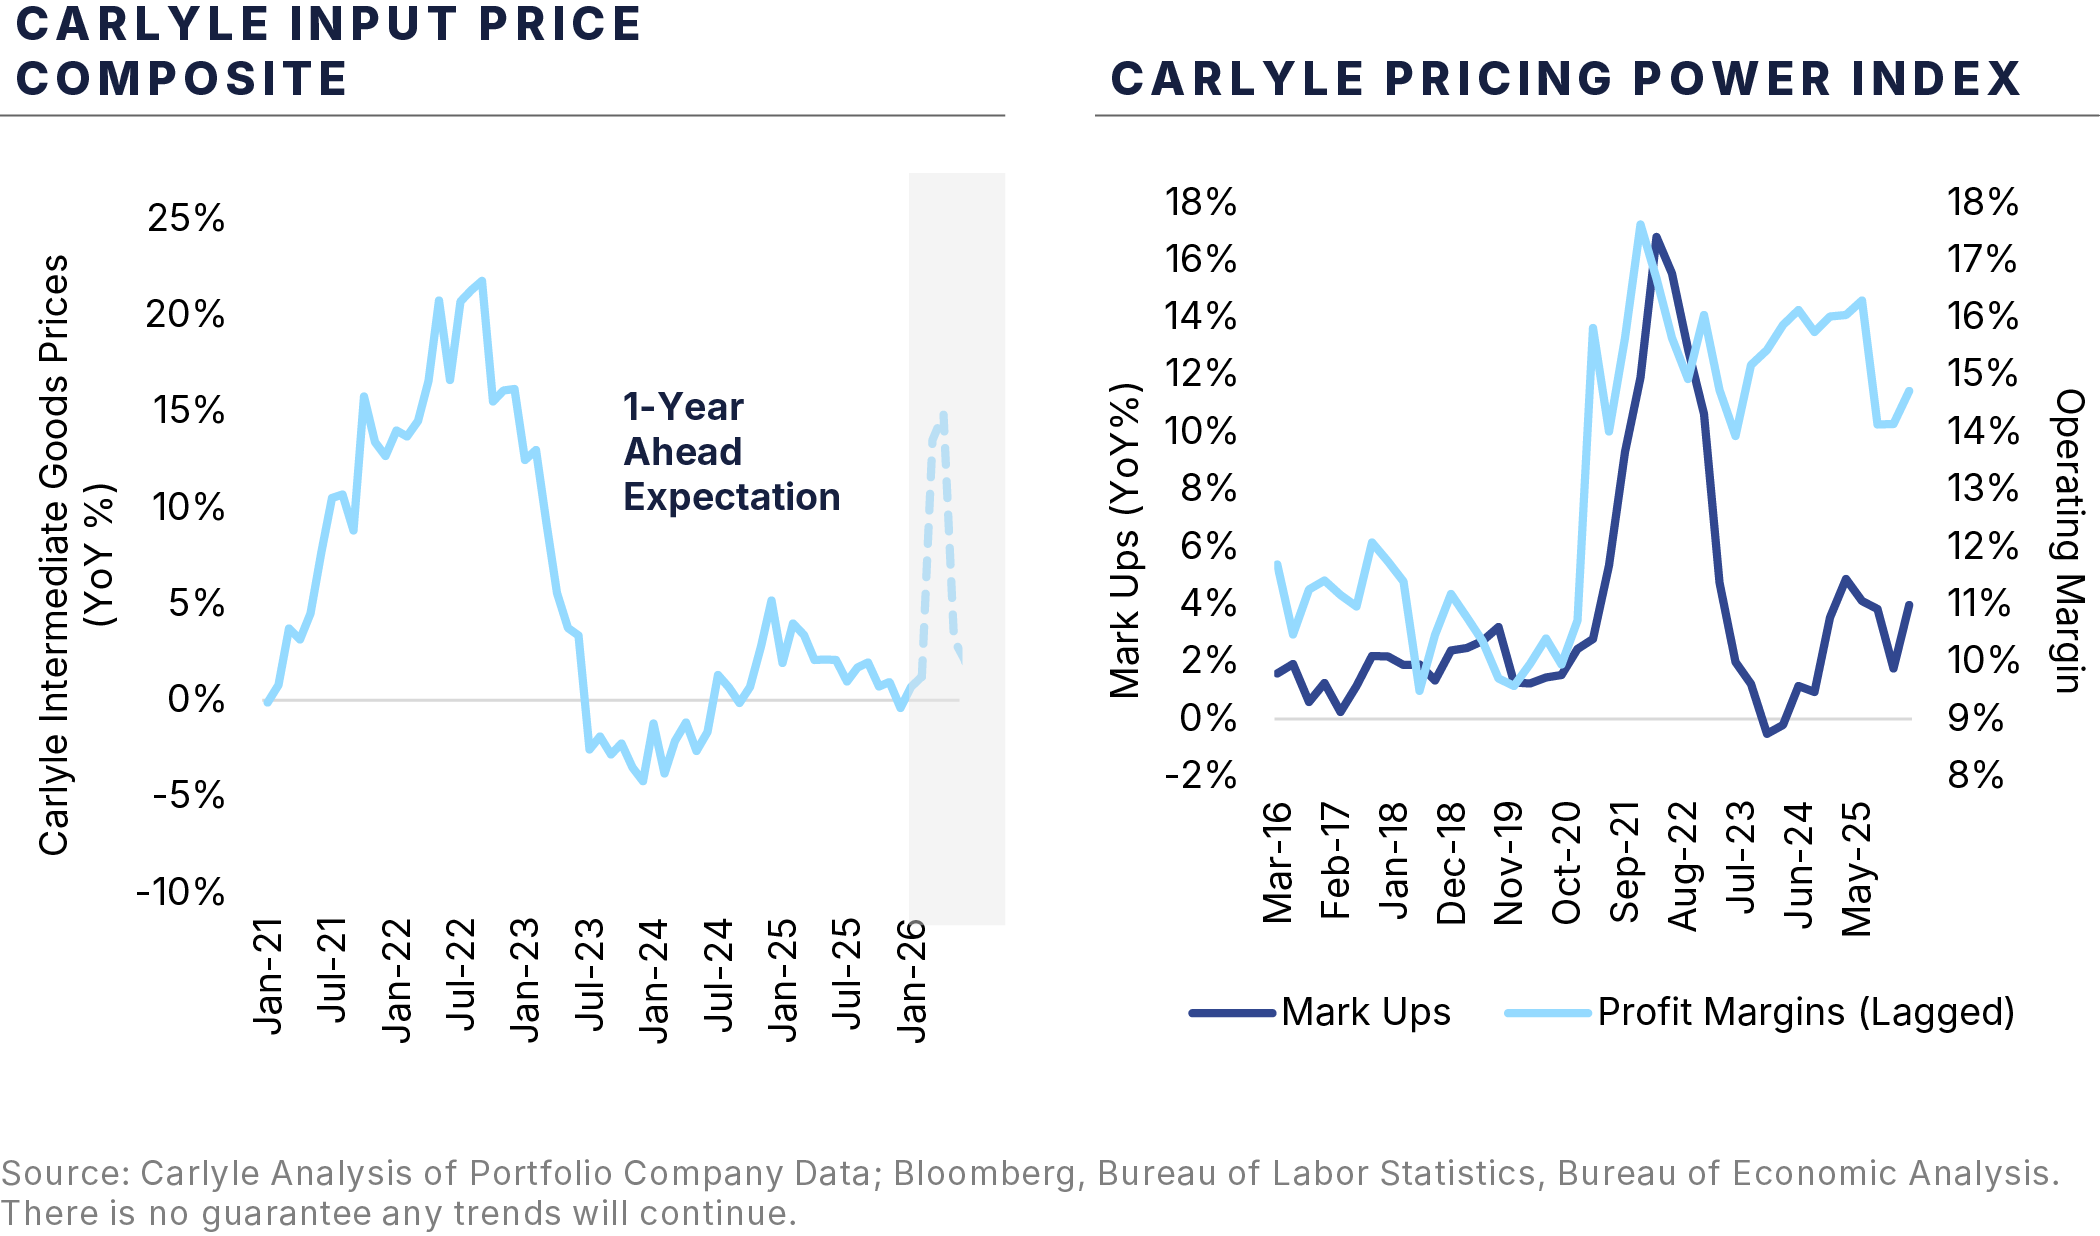
Those algorithms are likely to prove extremely important in the months ahead. Portfolio-wide energy prices increased at a 20% annualized rate in March and U.S. diesel prices finished the month 50% above year-ago levels. Businesses expect the prices of petrochemicals, metals, helium, and other inputs to escalate further in Q2-2026, which led to a 19% increase in Q1 logistics volumes as businesses accelerate deliveries and substitute (more energy-efficient) rail for trucking. Though prices are expected to normalize as fast as they rose, virtually every impacted business seems focused on “taking price” to defend margins between now and then (Figure 3).
Figure 3: Demand pulled forward in anticipation of higher prices/shortages
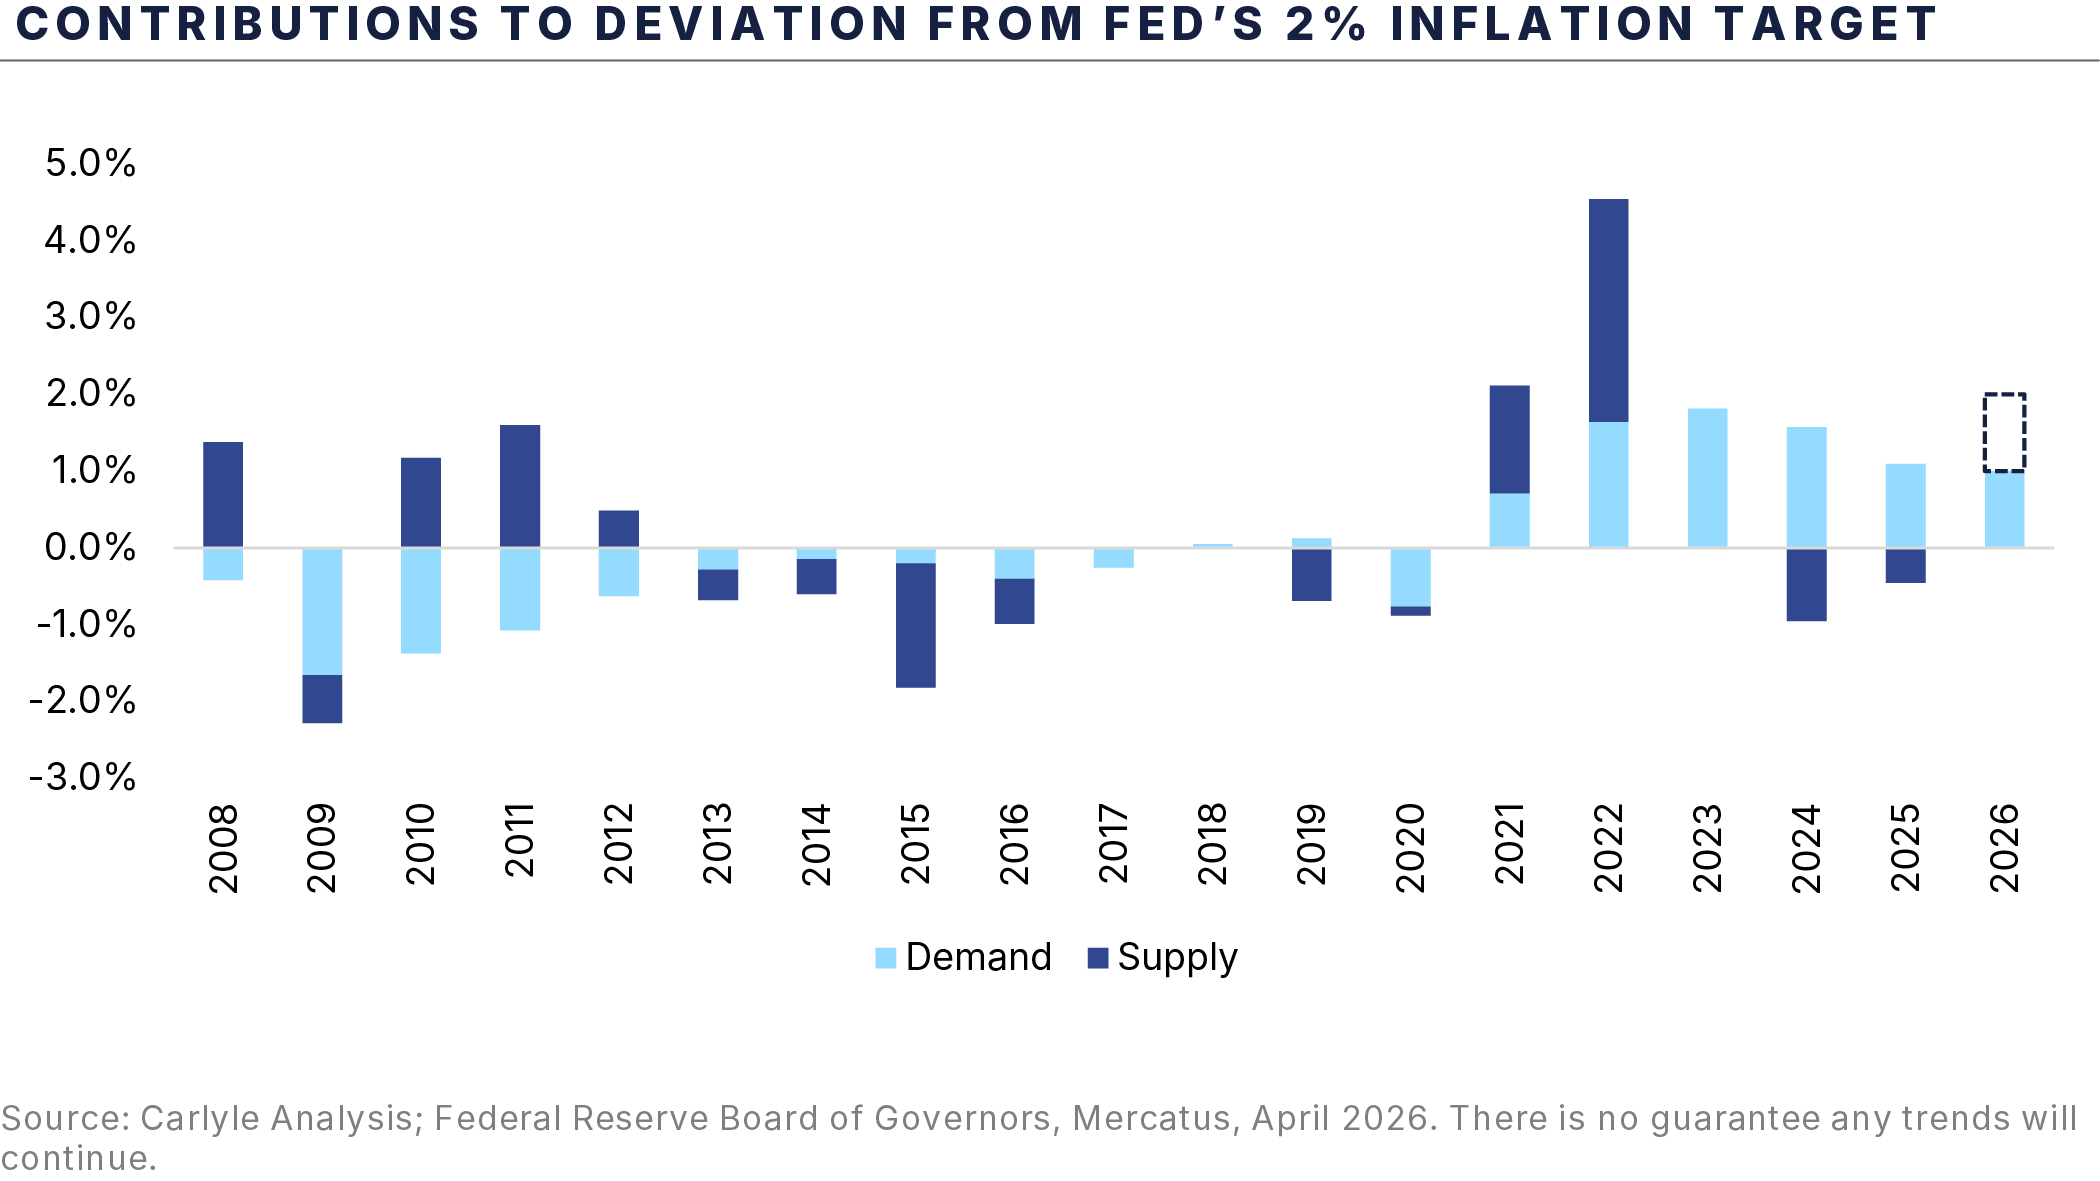
At this point, our data are consistent with a short-term price shock and distortion in volumes/shipments rather than sustained inflation. But it’s important to appreciate that energy and durable consumer goods have been the expenditure categories doing the most to keep a lid on overall inflation. A reversal here seems likely to intensify households’ affordability concerns as the supply impulse transitions from disinflationary to inflationary (Figure 4).
Figure 4: Energy/productivity kept a lid on inflation in 2024-25
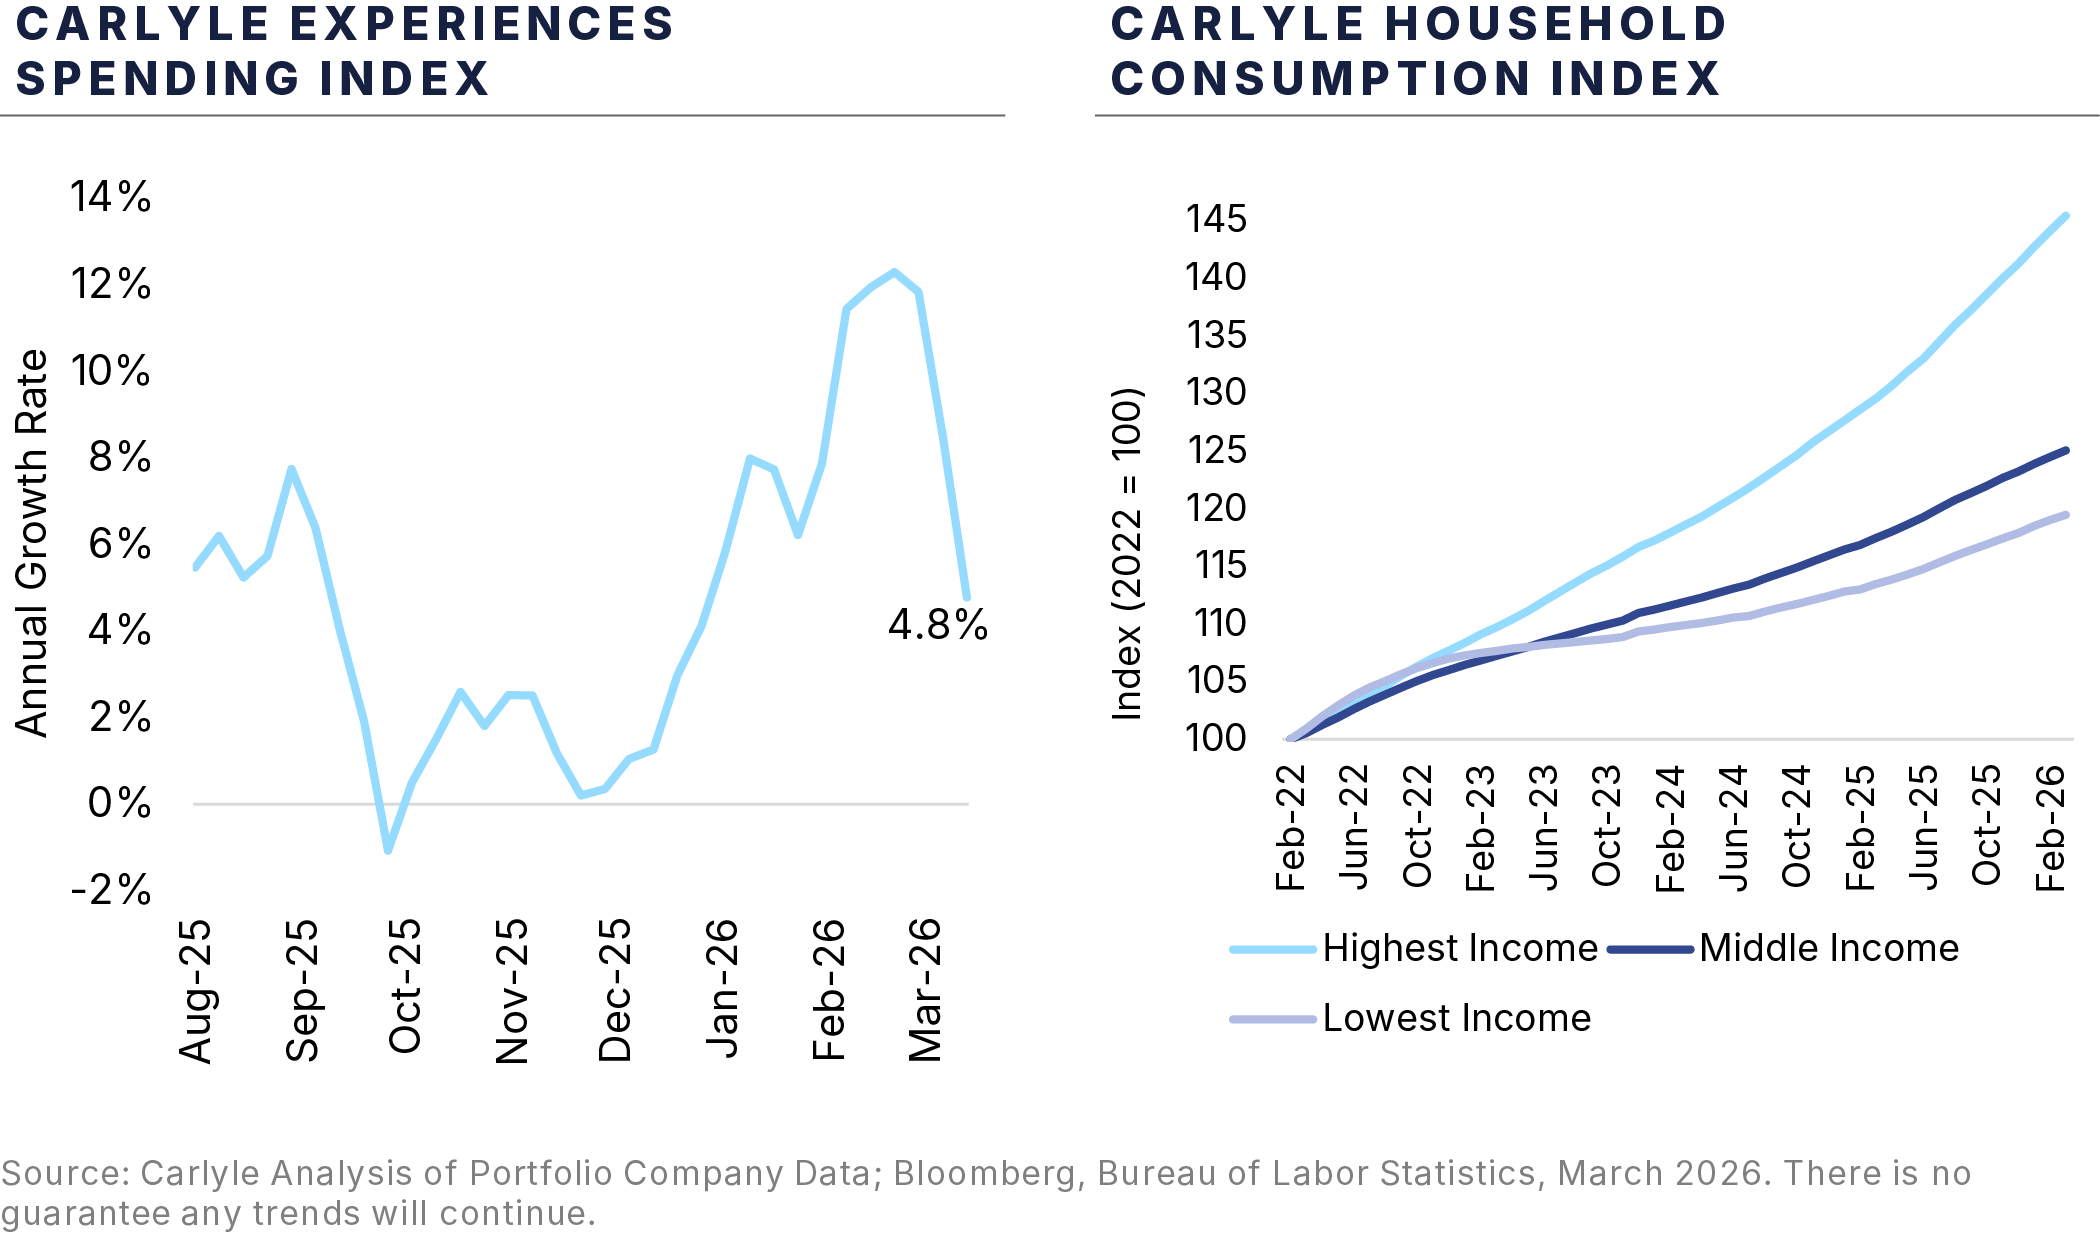
Price increases have also contributed to a deceleration in discretionary spending. After rebounding sharply in January and February, household spending on “experiences” – travel, tourism, dining out, live events – decelerated in March. Worse, sales came in below their prior trend in over 60% of the U.S. consumer and retail series we track, with weakness largely concentrated among the bottom third of the income distribution (Figure 5).
Figure 5: Some signs of stress in household spending
Divergence – across income categories and economies – has become more important than the global cycle itself. We saw evidence of a fading industrial recovery in Europe, with a sharp weakening of German orders and growing evidence that European logistics and industrial production may be curtailed if shortages intensify. By contrast, we saw firmer retail sales and industrial output in China despite a still-broken property sector. China imported more than 1.7 million barrels per day of oil from Iran in March, defying expectations that it would be among the economies hardest hit by the conflict. Taiwan and South Korea have been the main beneficiaries of the AI buildout, but insatiable demand for electronic components is no cure for shortages of the energy and inputs necessary to manufacture them. It looks as though initial cutbacks from helium and LNG shortfalls will focus on lower-value added chips, but if the Strait remains blocked, AI-related capex intentions will have to be pared back materially.
For many economies and sectors, a challenging Q2 seems baked in the cake. Geopolitical developments in the next few weeks should determine whether that is followed by a period of gradual normalization or another leg down.
Economic and market views and forecasts reflect our judgment as of the date of this presentation and are subject to change without notice. In particular, forecasts are estimated, based on assumptions, and may change materially as economic and market conditions change. Pacharbor Capital Group has no obligation to provide updates or changes to these forecasts. Certain information contained herein has been obtained from sources prepared by other parties, which in certain cases have not been updated through the date hereof. While such information is believed to be reliable for the purpose used herein, Pacharbor Capital Group and its affiliates assume no responsibility for the accuracy, completeness or fairness of such information. This material should not be construed as an offer to sell or the solicitation of an offer to buy any security in any jurisdiction where such an offer or solicitation would be illegal. We are not soliciting any action based on this material. It is for the general information of investors of Pacharbor Capital Group. It does not constitute a personal recommendation or take into account the particular investment objectives, financial situations, or needs of individual investors.