
Newton’s Third Law of Economics


For a time, it seemed that the tariffs unveiled in April might precipitate a full-blown U.S.-EU trade war. EU officials not only promised “reciprocal” tariff rates on U.S. goods, but also threatened invocation of the EU’s “anti-coercion” measures, which would open the door to discriminatory taxes on financial services, software, and digital applications where the U.S. runs large surpluses.
The EU’s bark proved worse than its bite. When the time for negotiations arrived, the EU acquiesced to the imbalance in tariff rates that their D.C. representatives insisted they’d never accept. EU negotiators even added a commitment to purchase $750 billion of U.S. energy as a sweetener to get the deal done.
The decision to stand down was motivated by security concerns. With a war raging in Eastern Europe and no one sure of Russia’s broader aims, EU leaders felt it an inopportune time to antagonize the government providing the security umbrella they’ve sheltered under for the past 30 years. To solidify U.S. support for the alliance, EU members of NATO even committed to increasing their defense spending target to 5% of GDP.
While derided by some as further capitulation, that spending was not merely designed to mollify the U.S. Administration. EU leaders recognized that they could not sit pari passu at the economic negotiating table with the U.S. so long as their security depended on the whims of U.S. elected officials. Economic autonomy depends on broader strategic autonomy, which could only be purchased through a substantial increase in defense outlays.
The net “burden” of the defense budget cannot be measured by the euros it consumes. Europe collectively spends about one-third as much on defense as the U.S., but this comparison is economically meaningless because three-quarters of Europe’s procurement budget funds the acquisition of hardware developed and manufactured elsewhere, mostly the U.S. Such spending impairs the fiscal and trade balance with no offsetting gains in domestic output, employment, or innovation. The more economically relevant comparison is the defense R&D budget, where Europe spends 1/12th as much as the U.S. (Figure 1).
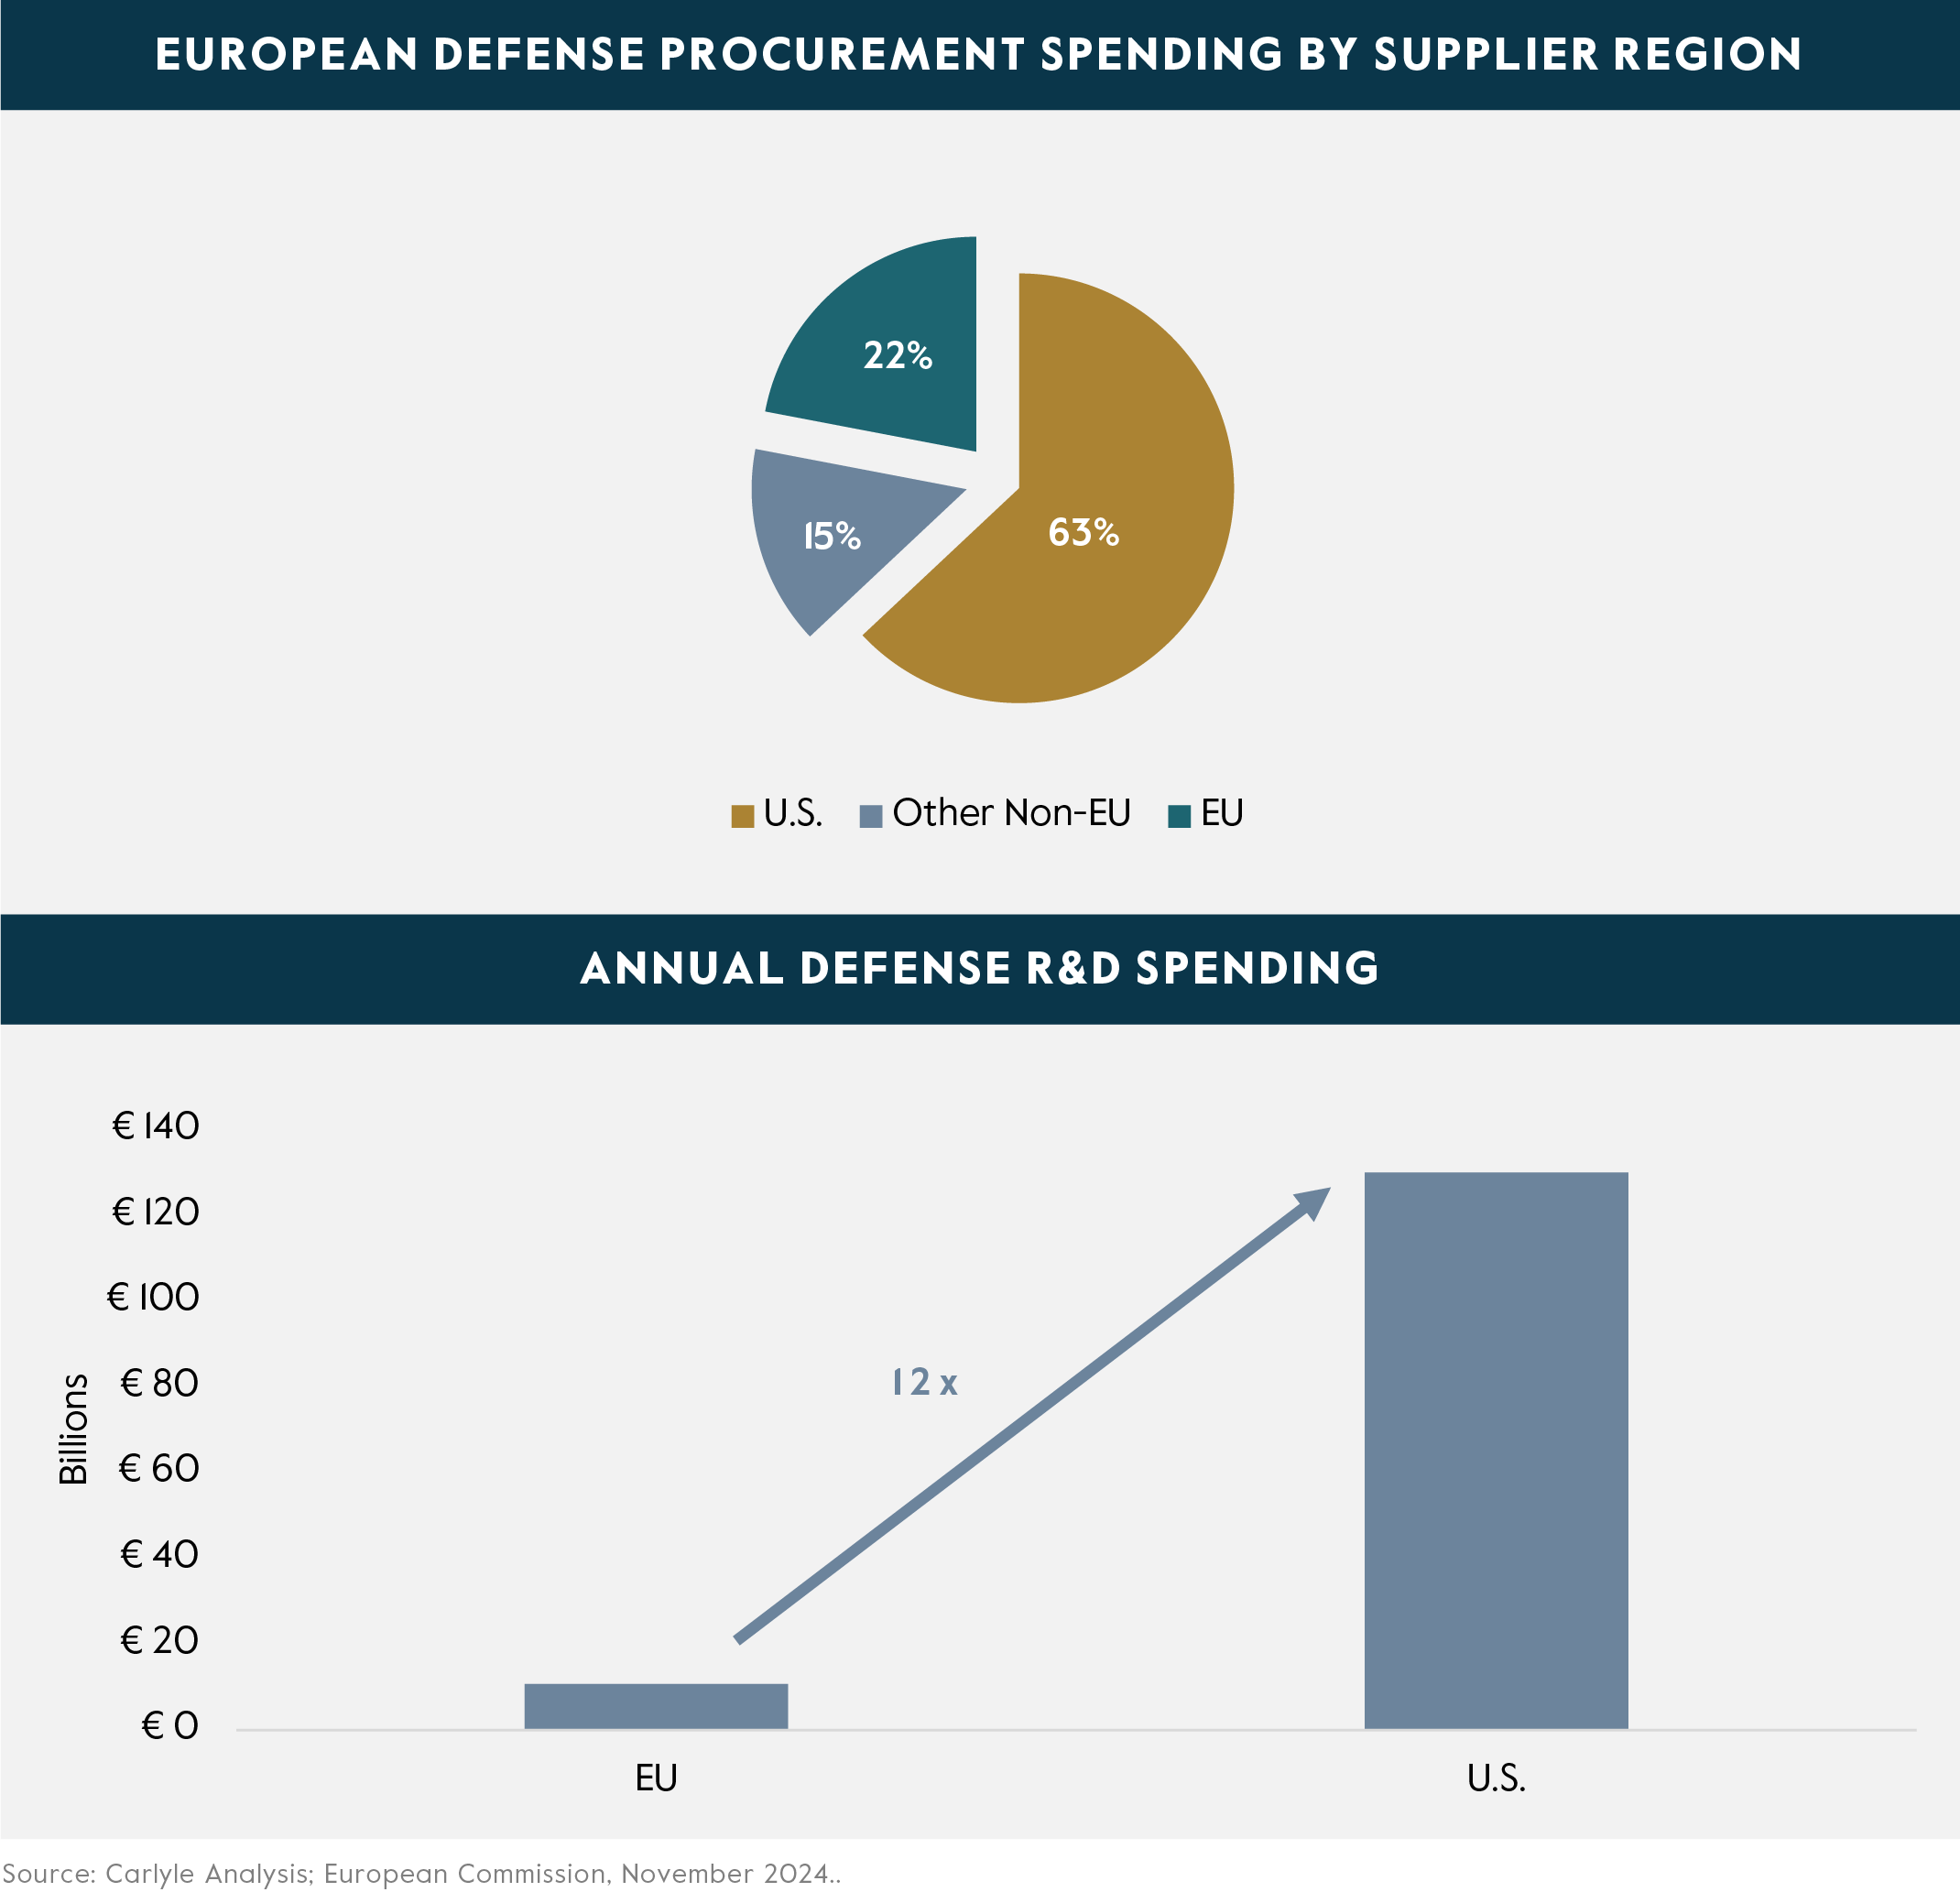
By “indigenizing” development and production, Europe could simultaneously increase the defense budget and reduce its net cost. Defense technologies often have commercial spillovers, hence trade policy’s focus on “dual use” technologies in commercial and military supply chains. The same is true of defense research itself, which has been shown to “crowd in” private sector R&D at a rate of €57 per €100 spent, a past finding likely to prove especially applicable today given the military’s focus on AI and cyber, autonomous navigation, propulsion technologies, space, and energy storage. R&D is not just an end in itself; it’s the key driver of total factor productivity growth, which has badly lagged that of the U.S. during the period when Europe was supposedly enjoying its “peace dividend.”
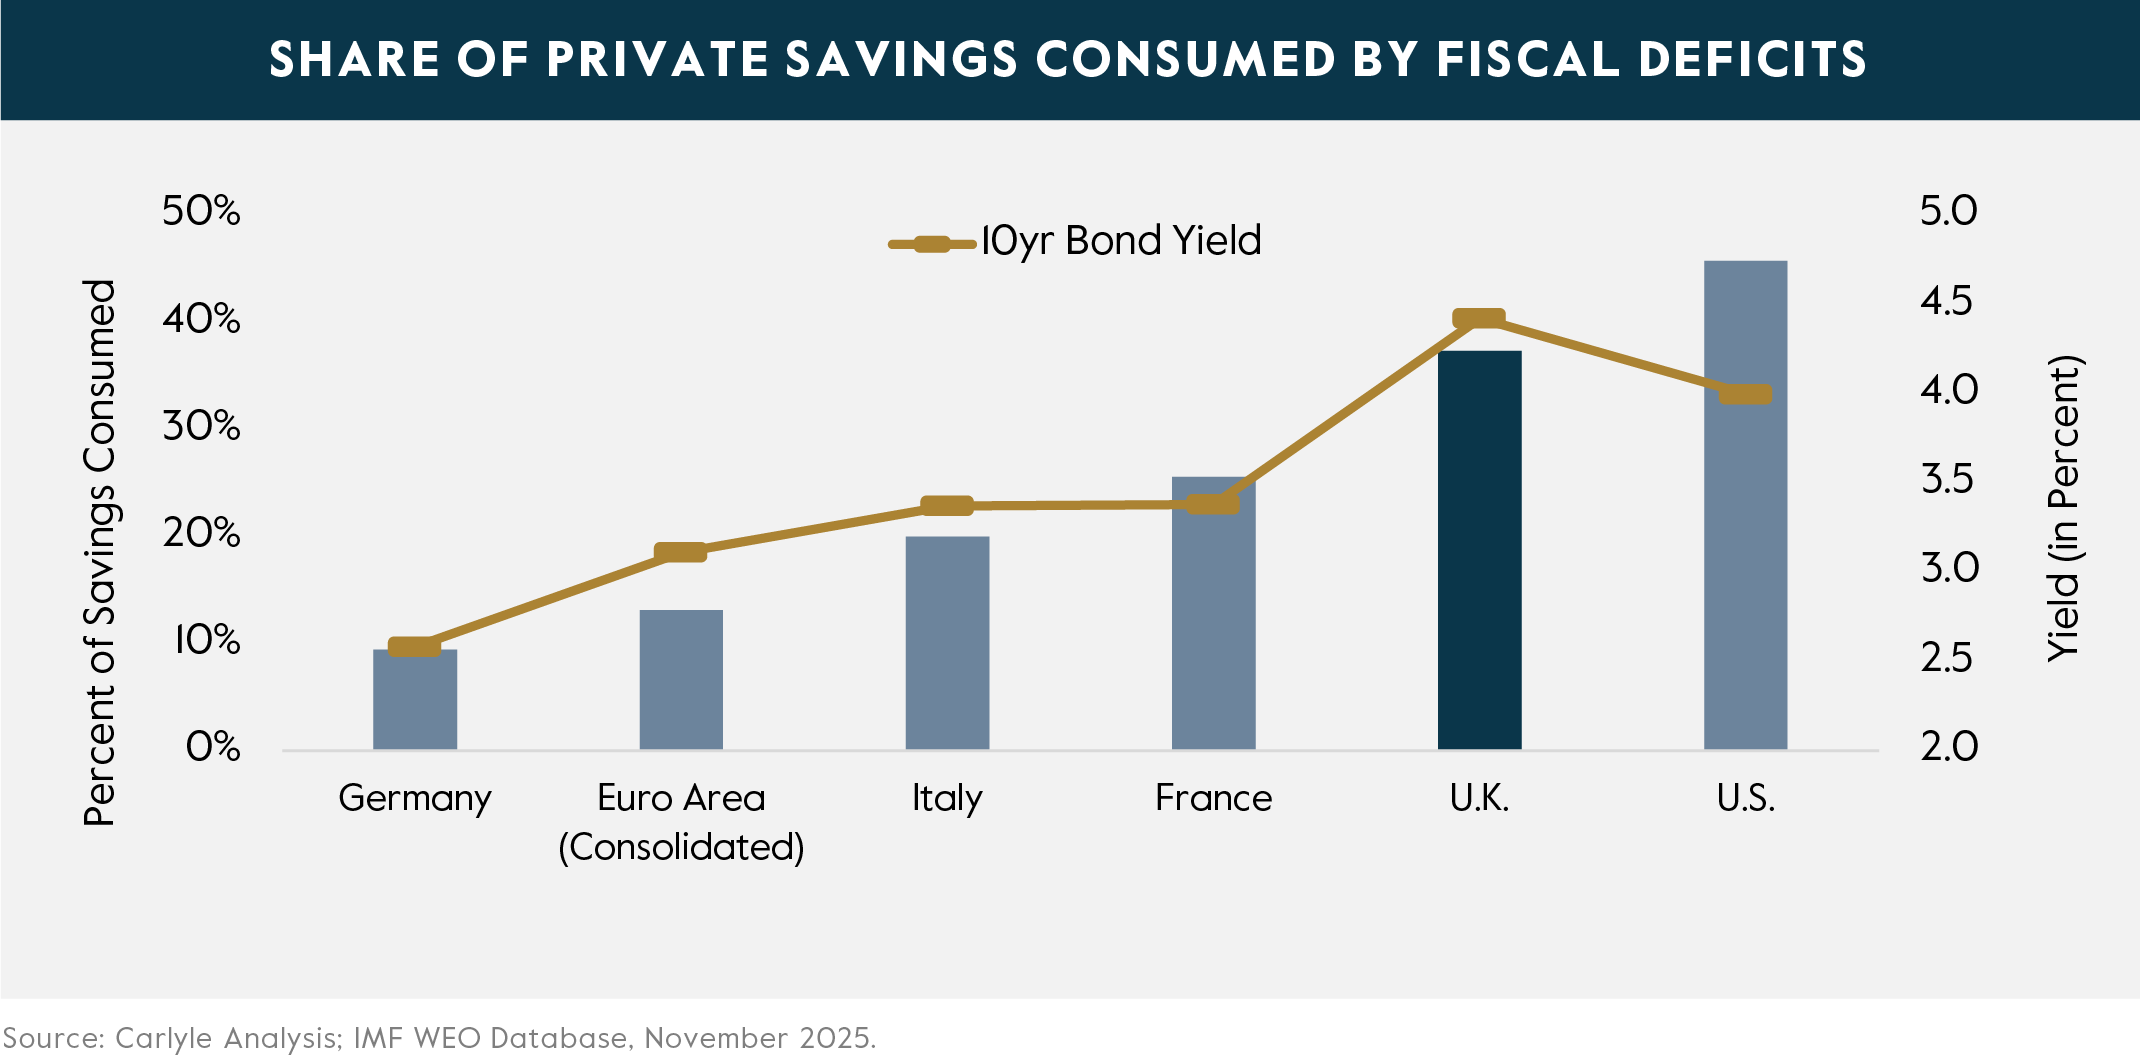
Does Europe have the fiscal space to make these investments, even if their eventual payoff is as robust as expected? While fiscal situations vary across member states, Europe remains a high savings economy. Fiscal deficits consume 60% less private saving in the EU as in the U.S. (Figure 2), suggesting more room for public spending than implied by traditional metrics.
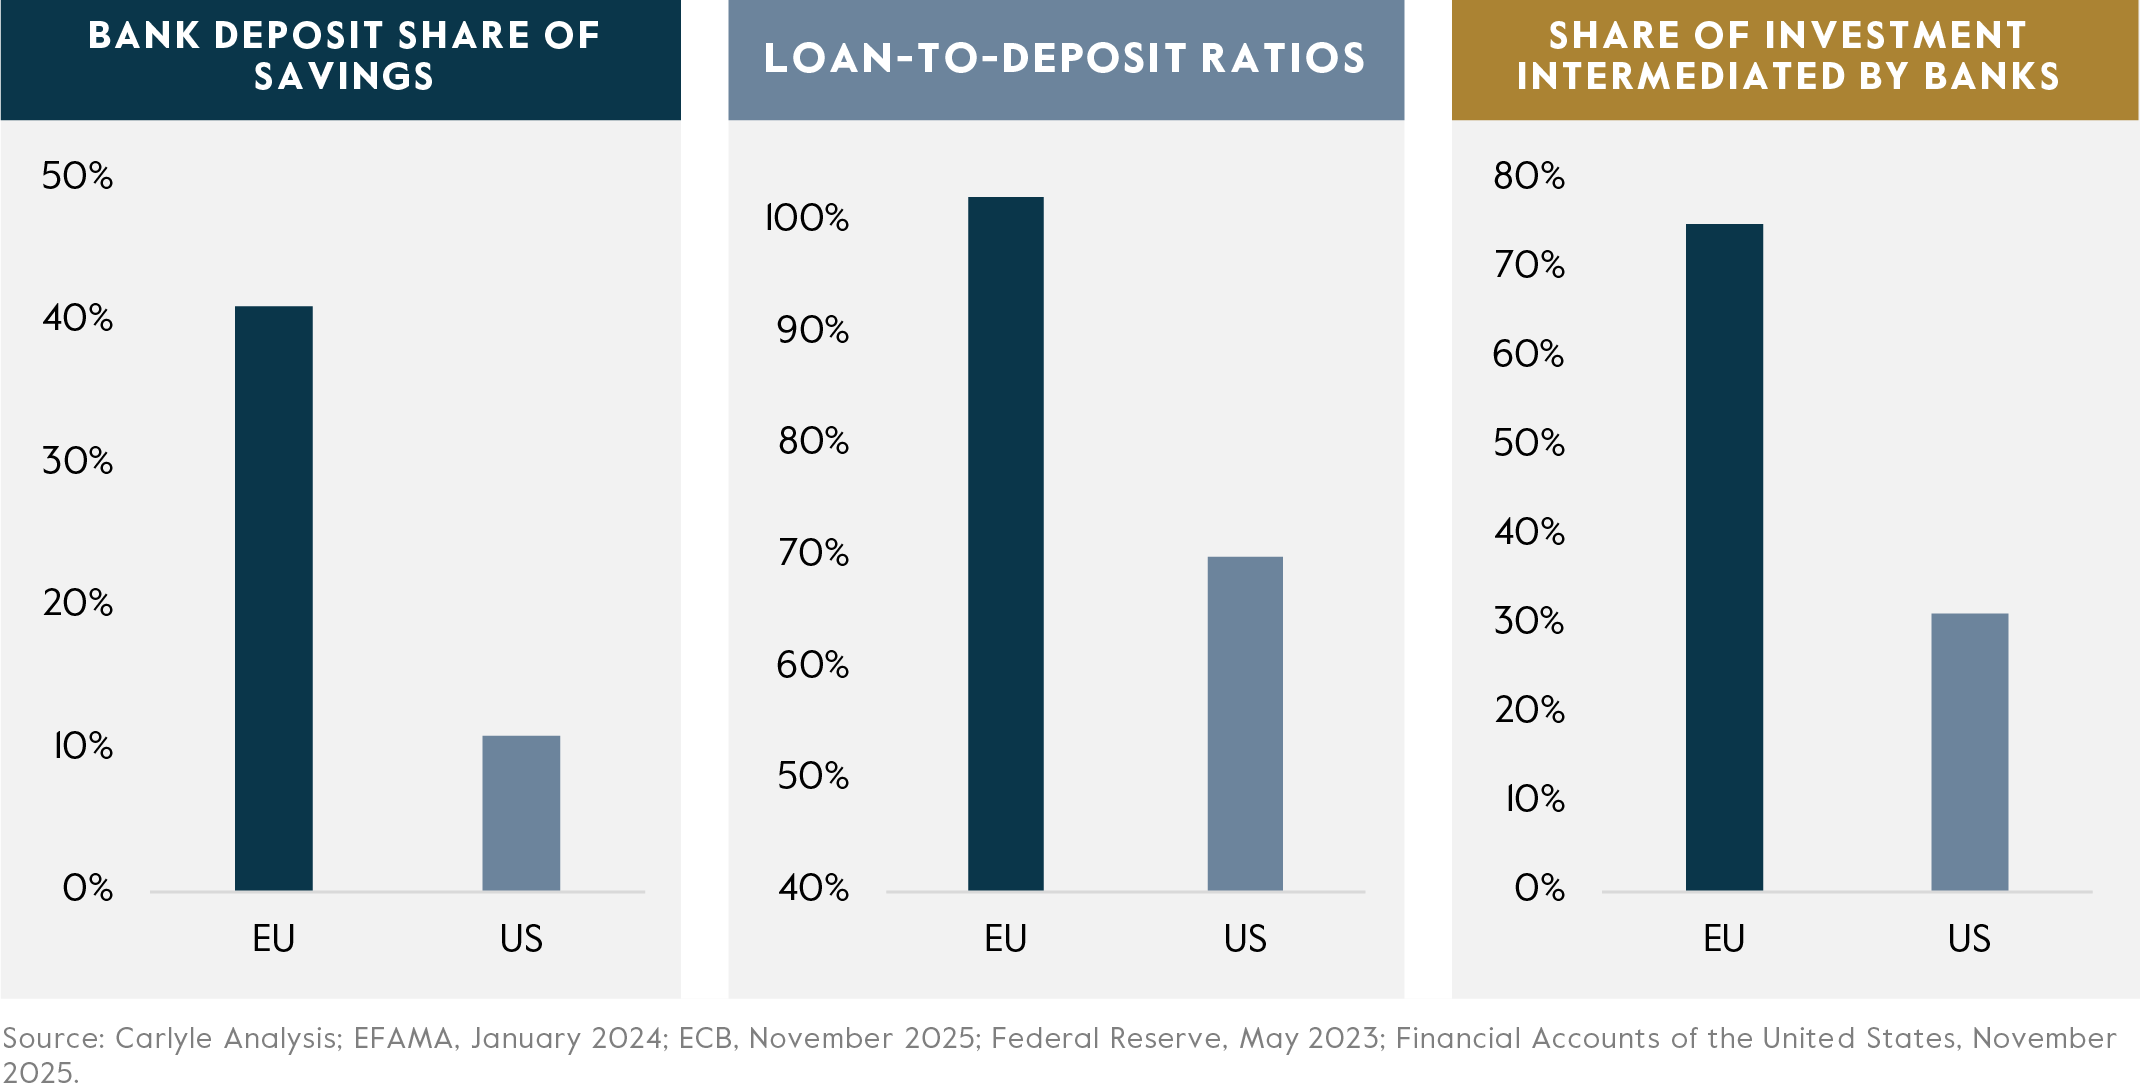
But if Europe is going to develop technologies for defense and adjacent commercial applications, more of its ample private savings must be channeled to private markets. Banks play too large a role in EU financial intermediation (Figure 3). They lack the capacity to bear the volatility and duration risk inherent to the cash flows of the businesses the EU needs to incubate and grow. Though public funds, like the European Investment Bank (EIB), can play an important role, much will depend on the success of the Savings and Investment Union, which aims to mobilize deposits for more productive uses.
The trade deal has also focused attention on the trade barriers that still exist in the EU single market. The IMF estimates that internal barriers—largely regulatory frictions and disparate product standards—function as implicit tariffs on intra-EU trade that are between 3x and 7x higher than those imposed by the U.S. The full elimination of these “tariffs” would fully offset the prospective cost of those imposed by the U.S. and encourage businesses to scale operations in Europe rather than the U.S.
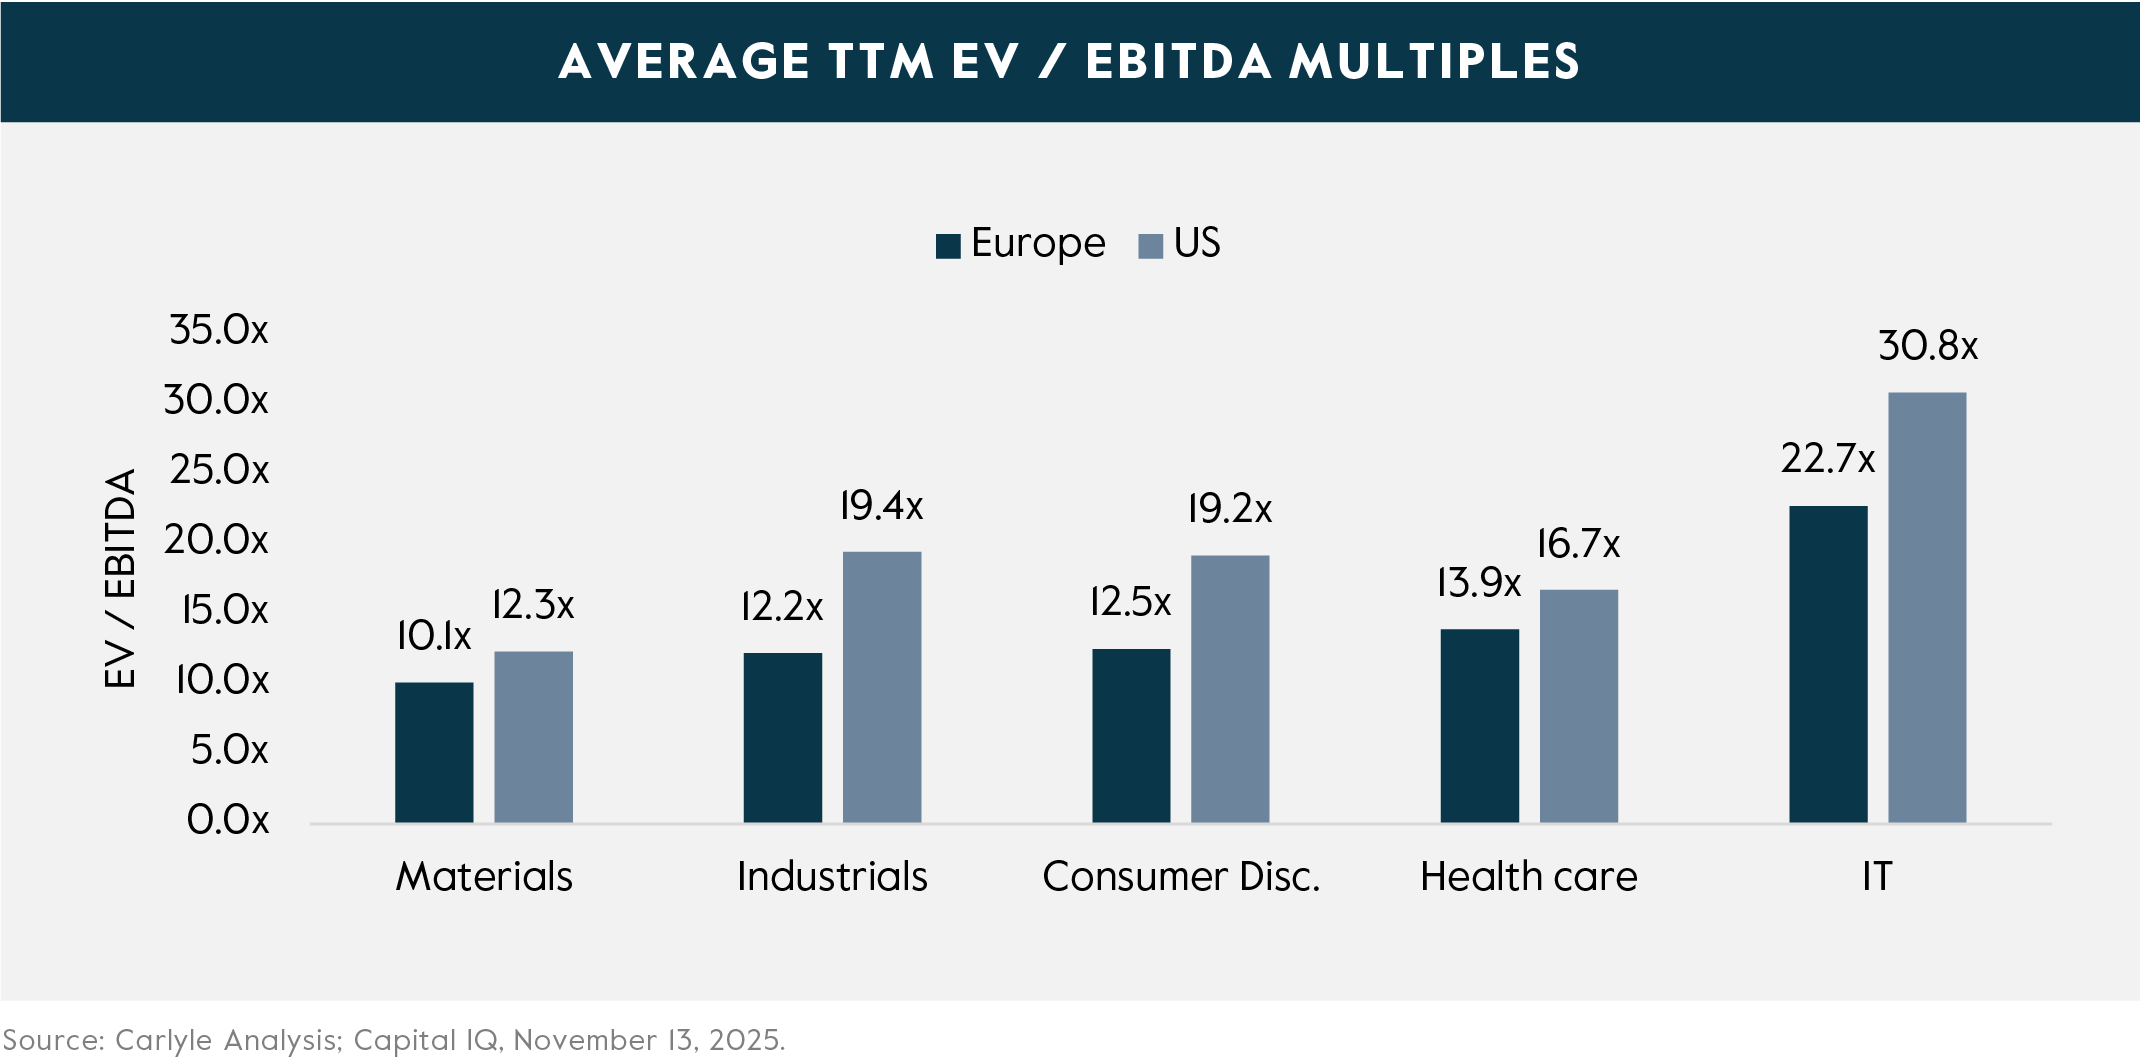
Investors remain well compensated for the risk that change does not materialize on the scale currently envisioned. Though the valuation gap with the U.S. has closed relative to the start of the year, it remains far wider than would obtain if these productivity gains were fully capitalized into EU asset prices (Figure 4). For those investors used to seeing everything priced to AI-inflected best-case scenarios, it’s nice to find entry points that leave room for upside surprise.
Economic and market views and forecasts reflect our judgment as of the date of this presentation and are subject to change without notice. In particular, forecasts are estimated, based on assumptions, and may change materially as economic and market conditions change. The Pacharbor Capital Group has no obligation to provide updates or changes to these forecasts. Certain information contained herein has been obtained from sources prepared by other parties, which in certain cases have not been updated through the date hereof. While such information is believed to be reliable for the purpose used herein, The Pacharbor Capital Group and its affiliates assume no responsibility for the accuracy, completeness or fairness of such information. References to particular portfolio companies are not intended as, and should not be construed as, recommendations for any particular company, investment, or security. The investments described herein were not made by a single investment fund or other product and do not represent all of the investments purchased or sold by any fund or product. This material should not be construed as an offer to sell or the solicitation of an offer to buy any security in any jurisdiction where such an offer or solicitation would be illegal. We are not soliciting any action based on this material. It is for the general information of clients of The Pacharbor Capital Group. It does not constitute a personal recommendation or take into account the particular investment objectives, financial situations, or needs of individual investors.