
Bursting the Bubble in the AI Debate


Like generals fighting the last war, investors and asset allocators can apply old valuation frameworks to new economic realities. Everyone can see the dramatic increase in the capital intensity of formerly “asset-light” businesses. But instead of focusing on what changed economics imply for company valuations, many analysts have become distracted by an “AI bubble” debate that often turns on one’s outlook for the technology itself.
Capital spending collapsed during the Global Financial Crisis (GFC). And this time really was different, as Rogoff and Reinhart warned. Every cycle since World War II followed a familiar pattern: periods of below-trend fixed investment (recessions) were followed by catch-up growth in outlays (recoveries). But there was no CapEx boom to follow this bust. By 2020, the U.S. capital stock was 20% smaller than one would have expected prior to the GFC (Figure 1).
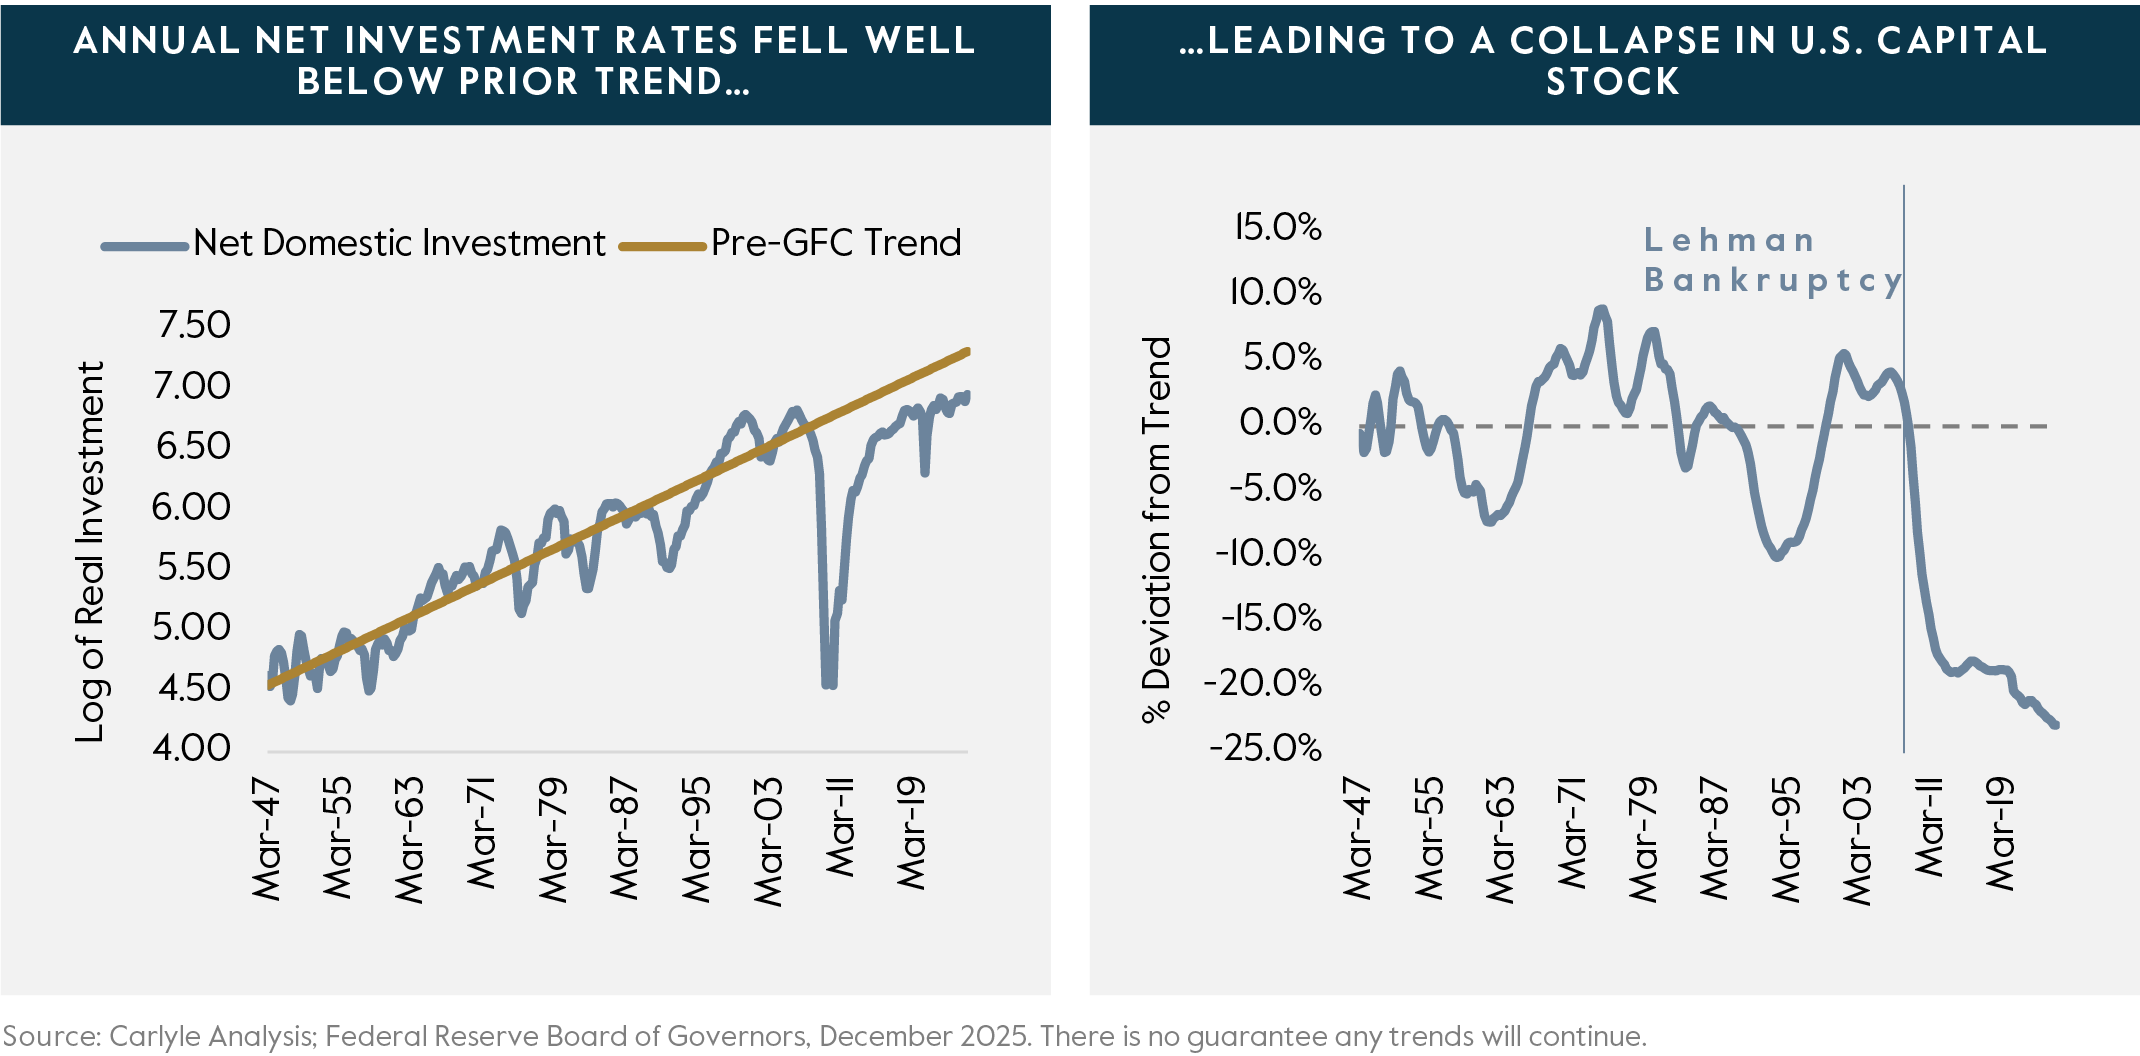
Though GDP also fell below its prior trend, its shortfall was nothing like the depression implied by the collapse in capital spending. Thanks to digitalization and globalization, companies found ways to grow without adding property, plant and equipment (PP&E).
Software and digital platforms (search, social media) scaled revenue without the incremental capital outlays required in the industrial era. And U.S. manufacturers (of smartphones, apparel, chips, etc.) increasingly focused domestic activities on services (product design and development, marketing), leaving the capital-intensive goods production to contract manufacturers (typically located in Asia). By 2020, real U.S. GDP was 7% larger than one would have expected based on the drop in capital spending.
For investors, this shift meant that old rules of thumb no longer applied.
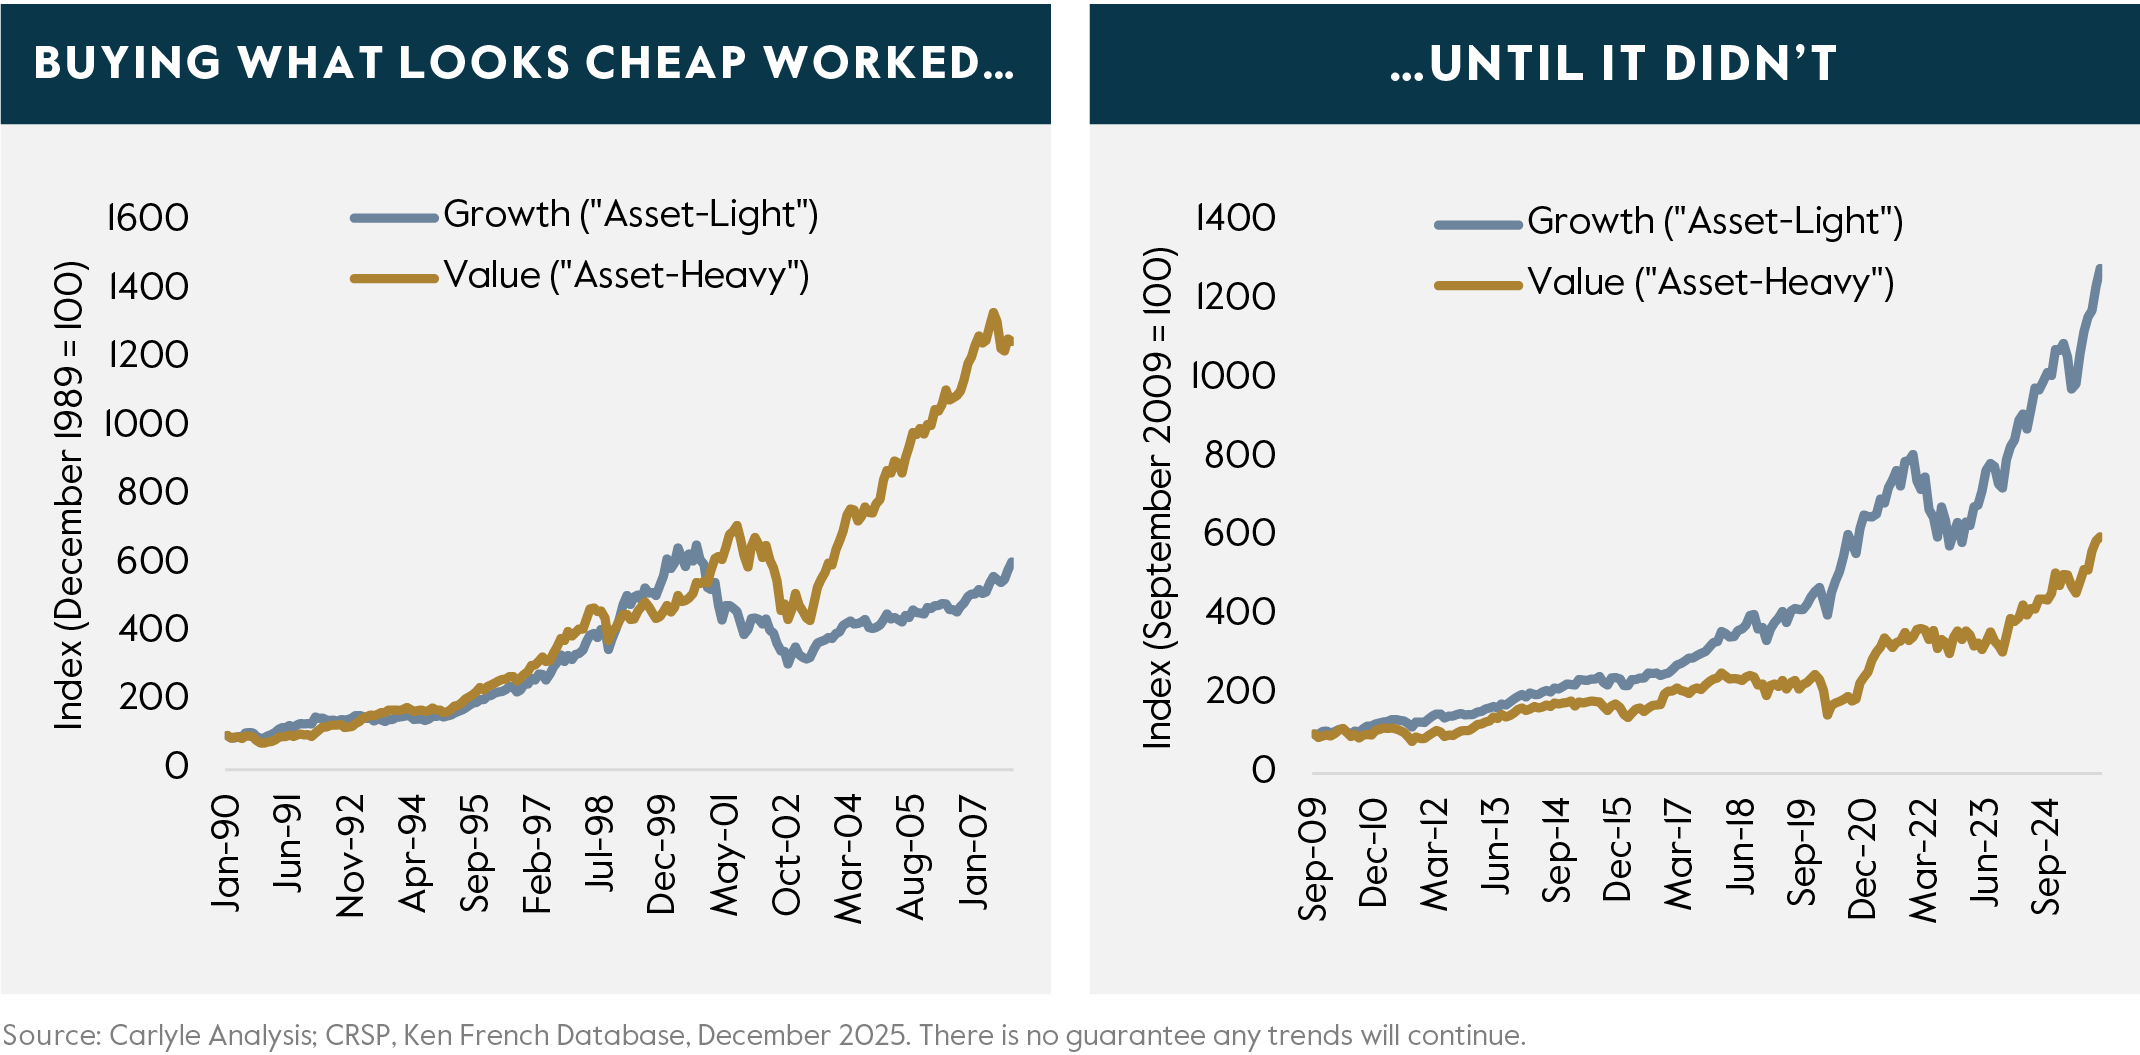
In the 1990s, academics demonstrated that, after controlling for size and market sensitivity, a company’s price-to-book ratio—essentially its market value relative to accounting value—was the most statistically significant determinant of future returns. From the start of 1990 to the 2007 stock market peak, the “cheapest” 20% of companies (relative to book value) outperformed the most “expensive” 20% of stocks by 450 basis points per year. And this period includes the 1998-2000 internet “bubble” when the market value of the priciest stocks surged.
Once companies’ earnings growth no longer bore any relation to the amount of physical assets they owned, book value no longer had the same predictive power. Since the start of the post-GFC recovery, the most “expensive” 20% of stocks have outperformed their “cheapest” counterparts by over 500 basis points per year (Figure 2). Many companies that looked overvalued according to the old framework were rich in intangible assets (data, software, proprietary technology, etc.) not reflected in accounting statements. Moreover, network effects, customer lock-in, and zero marginal costs often resulted in “winner-take-all” dynamics that allowed these “asset-light” businesses to scale revenues without ever having to add meaningfully to their physical asset base.
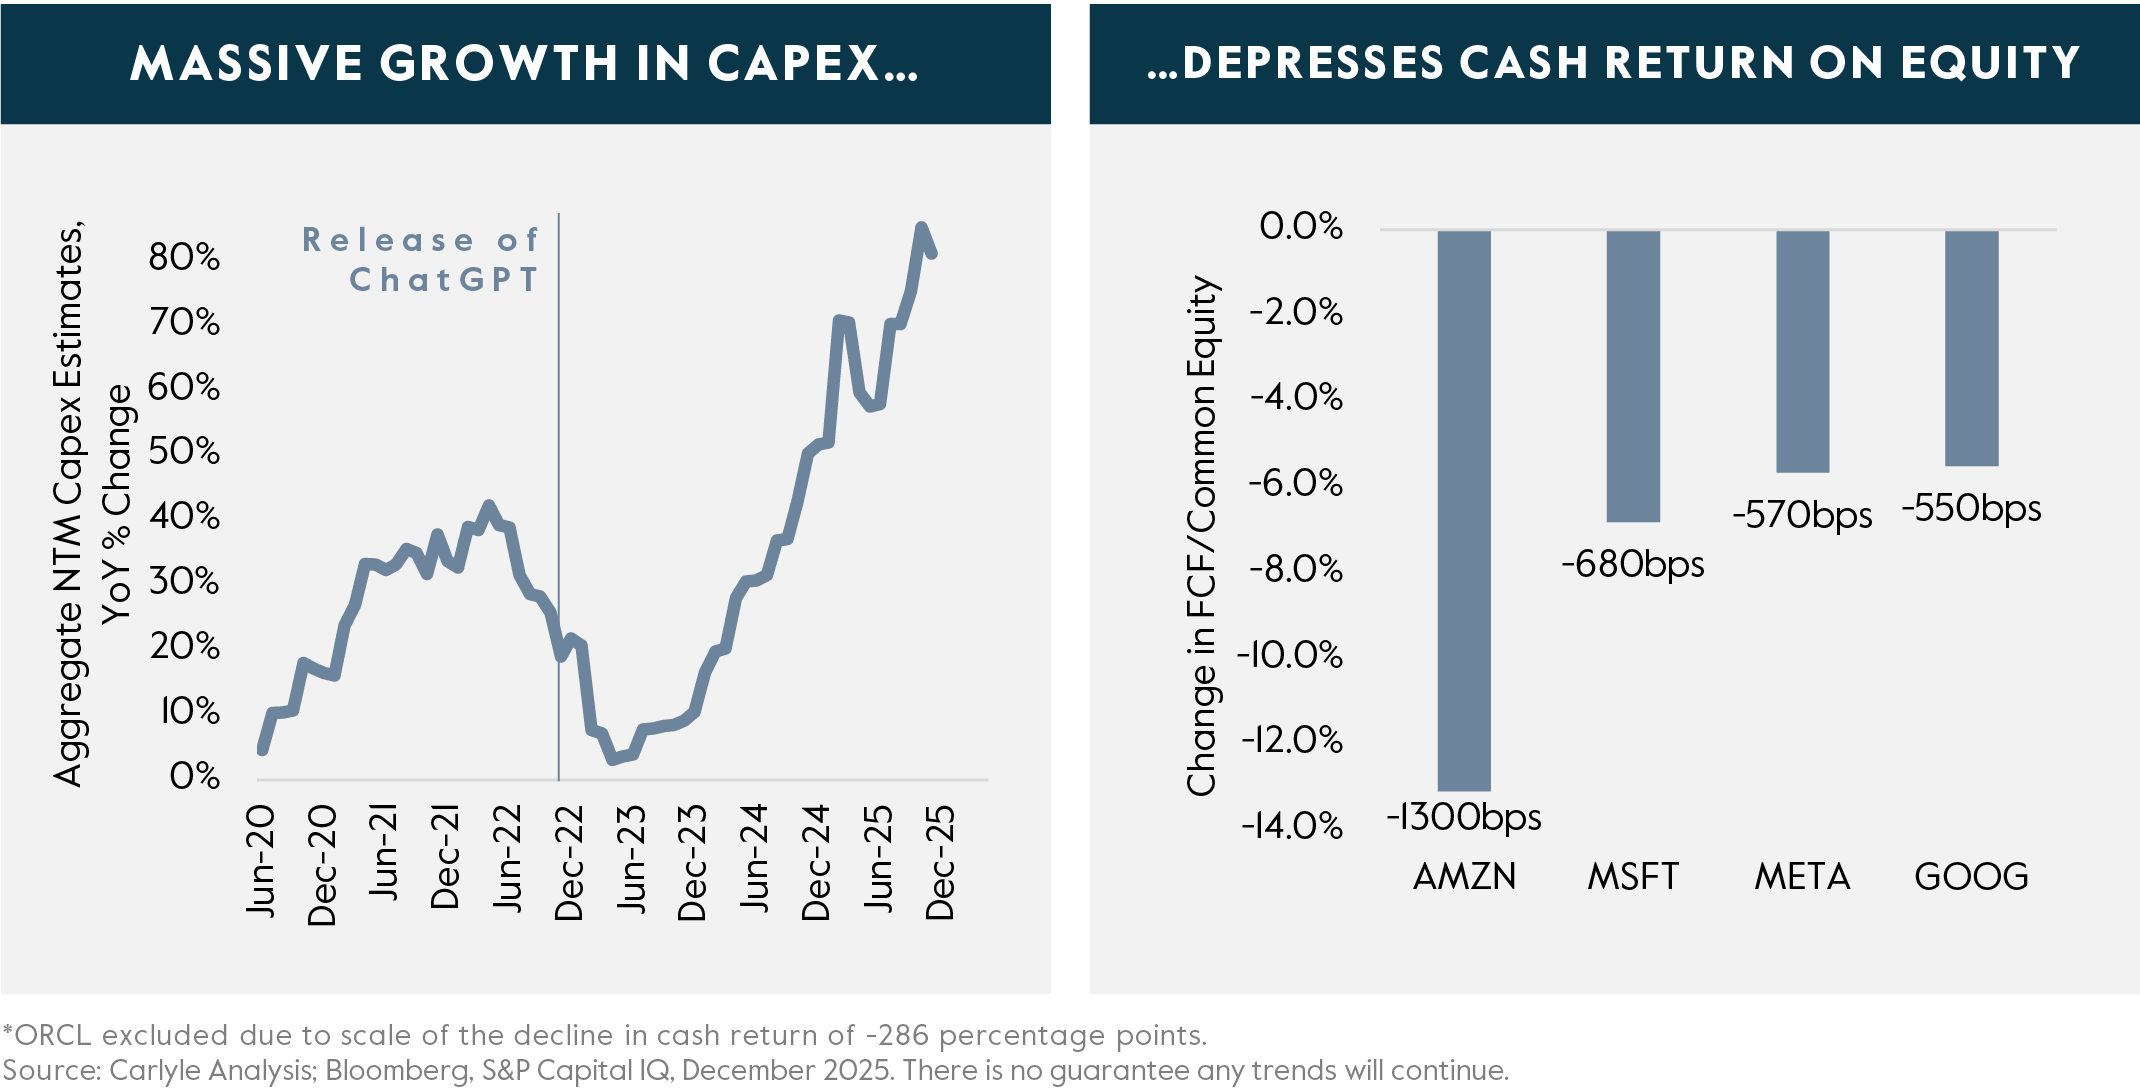
AI has changed everything. Since the end of 2023, five companies at the center of the “asset-light” revolution—Amazon, Alphabet (GOOG), Microsoft, Meta, and Oracle—have effectively abandoned their old business models in favor of a new capital-intensive approach. Their aggressive acquisition of “compute” capacity has caused their physical assets (PP&E) to increase by between 50% and 200% over that time. It’s no surprise that their cash return on equity—the free cash flow generated per unit of book value—has declined by between 600 to 1300 basis points (Figure 3).
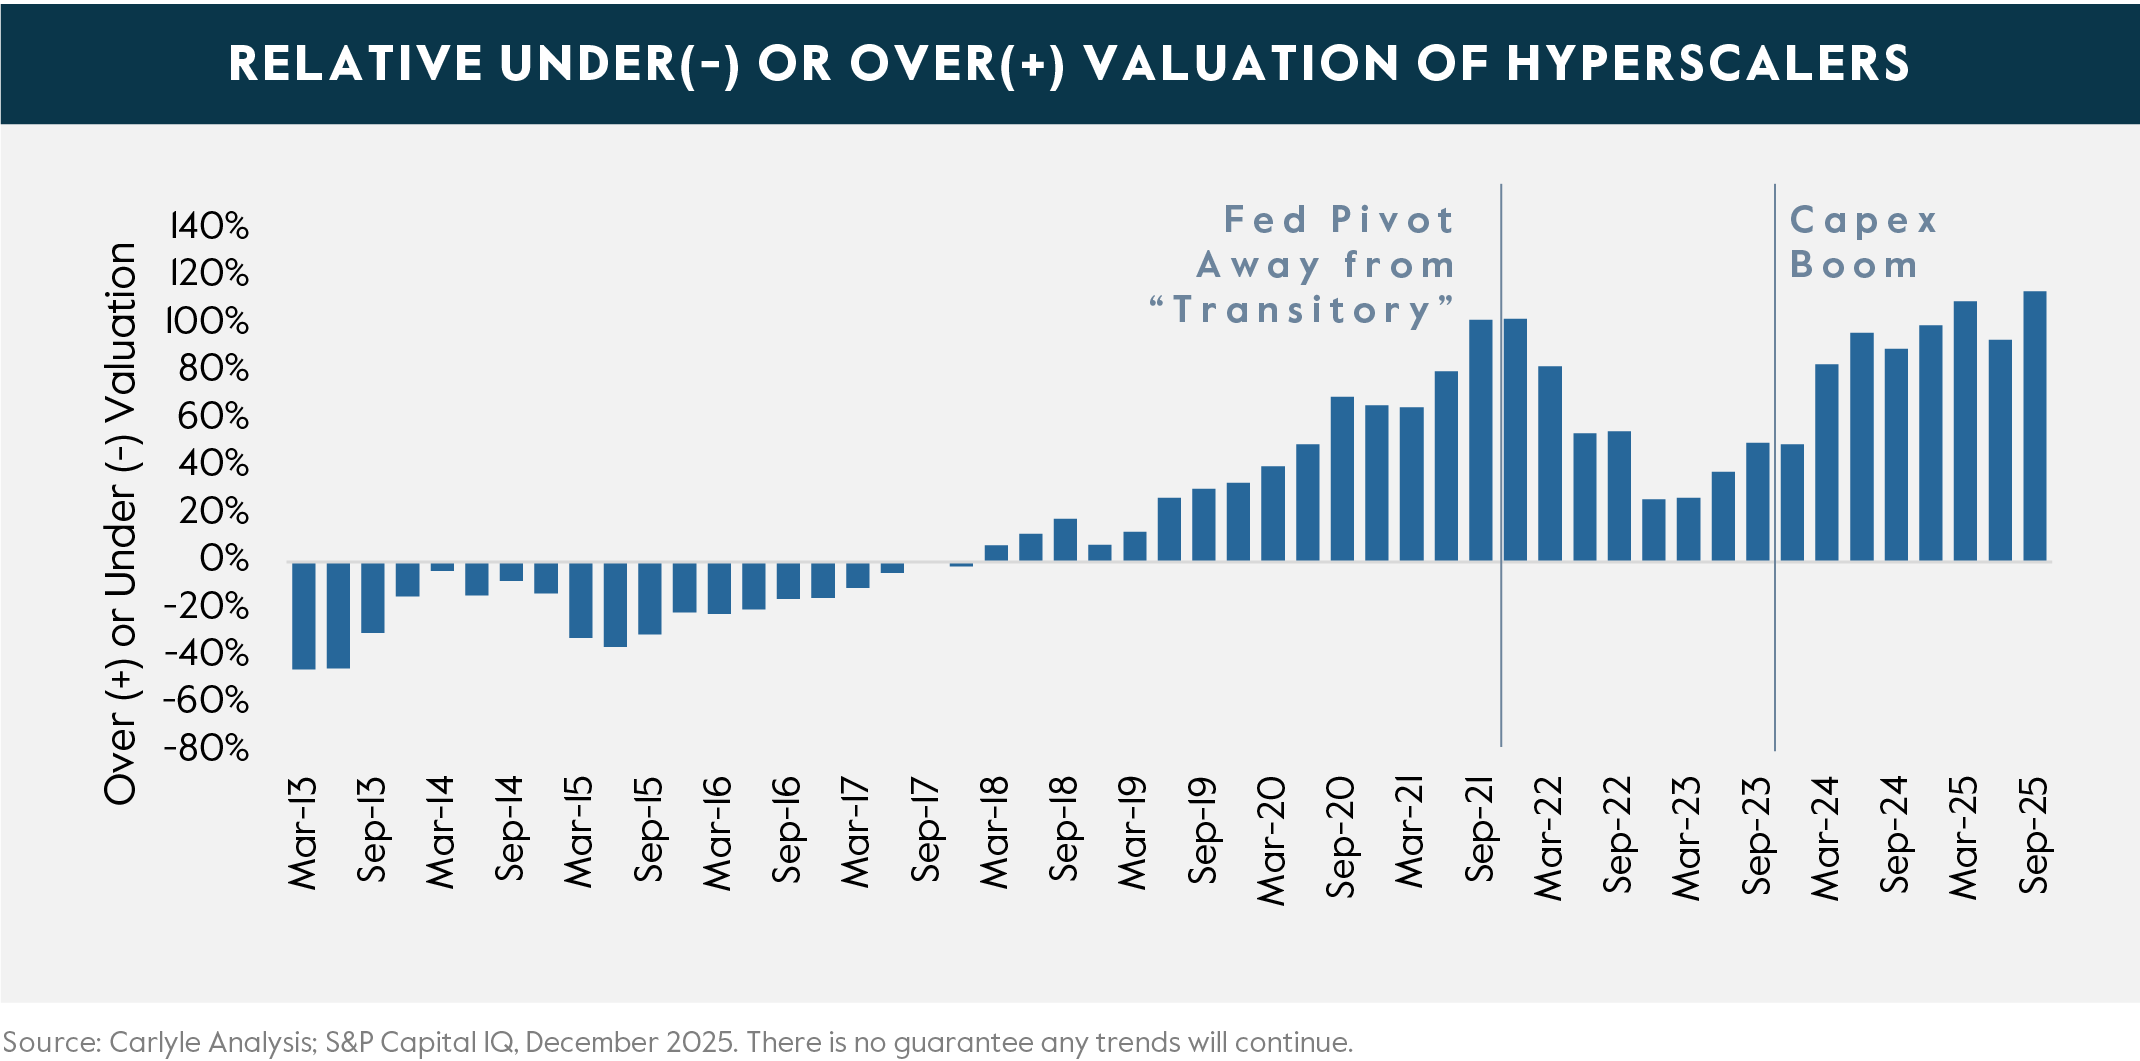
Investors continue to value these businesses as though nothing material has changed. When these companies were “asset-light,” paying 7x their accounting value made a lot of sense; you don’t value a money printing machine based on the cost of the paper or printing press! But at current price-to-book ratios, when they acquire $100 million in data center assets, shareholders are effectively asked to pay $1 billion, on average, for the purchase. Does this make sense?
If we assume that the PP&E on balance sheet should be valued at cost and assign a 10x P/B multiple to the rest, these companies’ market caps would be roughly half of what they are today (Figure 4). Perhaps this is too restrictive an assumption; one could reasonably assume they can make more productive use of AI servers than a man on the street. But it does provide a framework to think about valuations in an era where previously “virtual” companies suddenly need to concern themselves with industrial era minutia like capacity utilization and depreciation rates. And it raises questions about customers’ capacity to fund the operating expenses necessary to push the return on this capital to levels that validate current valuations.
Returns on physical assets rarely exhibit the sort of scale-free growth common to software and digital platforms. There’s nothing inconsistent about bullishness on AI and skepticism about the valuations of companies operating at the technology’s frontier.
Economic and market views and forecasts reflect our judgment as of the date of this presentation and are subject to change without notice. In particular, forecasts are estimated, based on assumptions, and may change materially as economic and market conditions change. The Pacharbor Capital Group has no obligation to provide updates or changes to these forecasts. Certain information contained herein has been obtained from sources prepared by other parties, which in certain cases have not been updated through the date hereof. While such information is believed to be reliable for the purpose used herein, The Pacharbor Capital Group and its affiliates assume no responsibility for the accuracy, completeness or fairness of such information. References to particular portfolio companies are not intended as, and should not be construed as, recommendations for any particular company, investment, or security. The investments described herein were not made by a single investment fund or other product and do not represent all of the investments purchased or sold by any fund or product. This material should not be construed as an offer to sell or the solicitation of an offer to buy any security in any jurisdiction where such an offer or solicitation would be illegal. We are not soliciting any action based on this material. It is for the general information of clients of The Pacharbor Capital Group. It does not constitute a personal recommendation or take into account the particular investment objectives, financial situations, or needs of individual investors.